


Figures
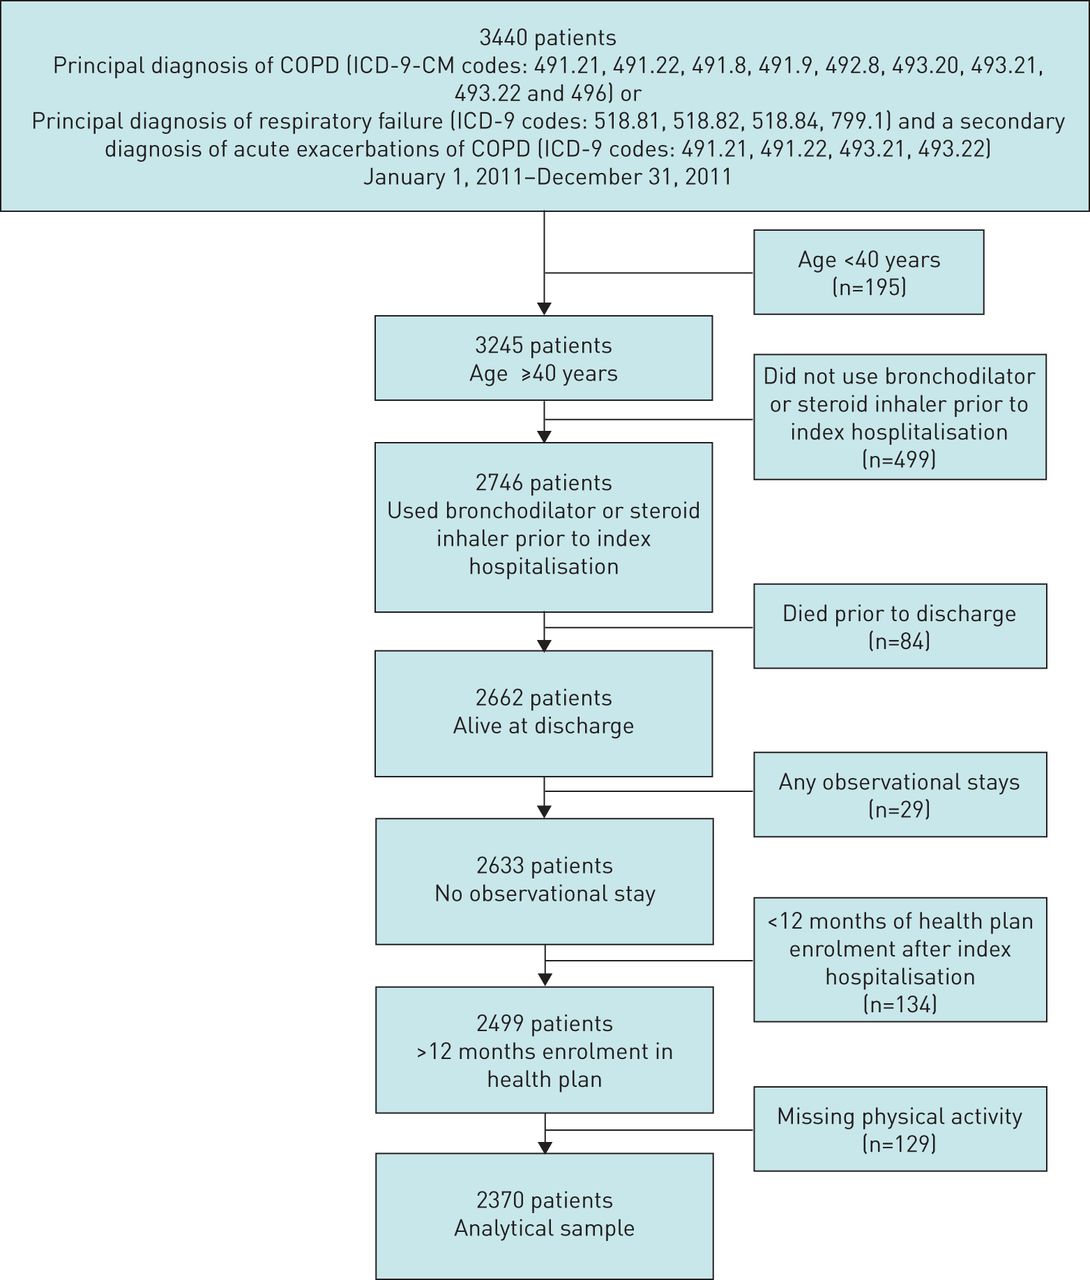
- FIGURE 1
Cohort selection. COPD: chronic obstructive pulmonary disease; ICD-9: International Classification of Diseases, Ninth Revision; CM: clinical modification.
- FIGURE 2
Kaplan–Meier curves of 12-month survival after an index chronic obstructive pulmonary disease-related hospitalisation according to level of moderate and vigorous physical activity (Log rank test, p<0.0001).


Tables
- TABLE 1
Characteristics of patients with index chronic obstructive pulmonary disease (COPD) hospitalisation according to level of moderate to vigorous physical activity
Inactive 0 min·week−1 Insufficiently active 1–149 min·week−1 Active ≥150 min·week−1 Total p-value Subjects n 1727 412 231 2370 Age years 73±10 71±11 71±10 73±11 <0.001 Female 963 (56) 228 (55) 117 (51) 1308 (55) 0.34 Marital status: partnered 781 (45) 204 (50) 124 (54) 1109 (47) 0.01 Education 0.002 High school or less 760 (44) 183 (44) 94 (41) 1037 (44) Some college or less 550 (32) 129 (31) 73 (31) 752 (32) College or higher 417 (24) 100 (24) 64 (28) 581 (25) Median household income $ 0.36 <50 000 717 (42) 161 (39) 86 (37) 964 (41) 50 000–79 999 703 (41) 177 (43) 93 (40) 973 (41) 80 000–99 999 189 (11) 52 (13) 35 (15) 276 (12) ≥100 000 112 (6) 21 (5) 17 (7) 150 (6) Missing 6 (0) 1 (0) 0 7 (0) Body mass index 0.02 Underweight <18.5 kg·m−2 132 (8) 25 (6) 11 (5) 168 (7) Normal 18.5–24.9 kg·m−2 540 (31) 144 (35) 85 (37) 769 (32) Overweight 25–29.9 kg·m−2 451 (26) 115 (28) 76 (33) 642 (27) Obese >30 kg·m−2 604 (35) 128 (31) 59 (26) 791 (33) Race 0.22 White 1177 (68) 268 (65) 161 (70) 1606 (68) Black 248 (14) 72 (17) 29 (13) 349 (15) Hispanic 200 (12) 47 (11) 26 (11) 273 (12) Asian/Pacific Islander 63 (4) 22 (5) 13 (6) 98 (4) Others 12 (1) 1 (0) 1 (0) 14 (1) Missing 27 (2) 2 (0) 1 (0) 30 (1) Insurance 0.07 Commercial 355 (21) 100 (24) 58 (25) 513 (22) Medicaid 35 (2) 9 (2) 2 (1) 46 (2) Medicare 1328 (77) 296 (72) 167 (72) 1791 (76) Private pay 9 (1) 5 (1) 4 (2) 18 (1) Missing 0 2 (0) 0 2 (0) Smoking status 0.36 Never 200 (12) 56 (14) 35 (15) 291 (12) Passive 12 (1) 0 (0) 1 (0) 13 (1) Former 1154 (67) 276 (67) 152 (66) 1582 (67) Current 361 (21) 80 (19) 43 (19) 484 (20) Immunisation Influenza vaccination 1354 (78) 333 (81) 184 (80) 1871 (79) 0.54 Pneumonia vaccination 1109 (64) 279 (68) 151 (65) 1539 (65) 0.40 Pulmonary rehabilitation 103 (6) 38 (9) 21 (9) 162 (7) 0.02 FEV1 % pred# 56.1±21.5 55.6±21.0 62.3±22.3 56.6±21.5 <0.01 FEV1/FVC 55.5±15.8 54.4±15.9 56.2±15.2 55.3±15.7 0.65 GOLD I: ≥80% pred 112 (6) 32 (8) 30 (13) 174 (7) 0.03 GOLD II: 50%≤FEV1 <80% pred 432 (25) 106 (26) 63 (27) 601 (25) GOLD III: 30%≤FEV1 <50% pred 278 (16) 68 (17) 32 (14) 378 (16) GOLD IV: FEV1 <30% pred 100 (6) 30 (7) 9 (4) 139 (6) Missing 805 (47) 176 (43) 97 (42) 1078 (45) Medications Short-acting beta-agonist 1595 (92) 377 (92) 204 (88) 2176 (92) 0.11 Short-acting anticholinergic 1002 (58) 231 (56) 125 (54) 1358 (57) 0.45 LABA 816 (47) 189 (46) 104 (45) 1109 (47) 0.75 Long-acting anticholinergic 626 (36) 157 (38) 72 (31%) 855 (36) 0.21 ICS 1337 (77) 313 (76) 170 (74) 1820 (77) 0.39 LAMA and ICS¶ 546 (32) 134 (33) 66 (29) 746 (31) 0.57 LABA and ICS¶ 808 (47) 188 (46) 102 (44) 1098 (46) 0.72 Long-term systemic corticosteroids 235 (14) 55 (13) 19 (8) 309 (13) 0.07 Oxygen use prior to index hospitalisation 315 (18) 70 (17) 24 (10) 409 (17) 0.01 New oxygen use post-index hospitalisation 184 (11) 52 (13) 31 (13) 267 (11) 0.29 Comorbidities Anaemia present at hospitalisation 280 (16) 71 (17) 29 (13) 380 (16) 0.28 Heart failure 664 (38) 134 (33) 48 (21) 846 (36) <0.001 Pulmonary hypertension 243 (14) 49 (12) 18 (8) 310 (13) 0.02 Diabetes 590 (34) 130 (32) 60 (26) 780 (33) 0.04 Depression 359 (21) 82 (20) 35 (15) 476 (20) 0.13 Anxiety 110 (6) 34 (8) 12 (5) 156 (7) 0.26 Solid tumour without metastasis 297 (17) 68 (17) 41 (18) 406 (17) 0.91 Metastatic cancer 43 (2) 10 (2) 2 (1) 55 (2) 0.30 Charlson comorbidity index 4.0±2.6 3.7±2.6 3.1±2.4 3.9±2.6 <0.001 0–1 332 (19) 91 (22) 63 (27) 486 (21) <0.01 2 280 (16) 71 (17) 49 (21) 400 (17) ≥3 1115 (65) 250 (61) 119 (52) 1484 (63) Hospitalisation in prior year COPD-related hospitalisation 487 (28) 110 (27) 44 (19) 641 (27) <0.01 2.0±1.8 2.1±1.9 1.8±1.8 2.0±1.8 Non-COPD-related hospitalisation 380 (22) 88 (21) 51 (22) 519 (22) 0.05 2.4±2.2 2.3±2.2 2.0±1.5 2.3±2.2 Length of stay for index 4.9±4.1 4.3±3.0 4.2±2.9 4.7±3.9 0.04 Hospitalisation days 1–2 389 (23) 109 (26) 69 (30) 567 (24) 3 386 (22) 108 (26) 55 (24) 549 (23) 4–6 636 (37) 135 (33) 78 (34) 849 (36) 7–13 256 (15) 51 (12) 25 (11) 332 (14) 14–59 60 (3) 9 (2) 4 (2) 73 (3) Discharge disposition for index hospitalisation 0.001 Home 1508 (87) 386 (94) 221 (96) 2115 (89) Post-acute (skilled nursing) 125 (7) 16 (4) 6 (3) 147 (6) Hospice 56 (3) 5 (1) 1 (0) 62 (3) Hospital 6 (0) 0 (0) 0 (0) 6 (0) Other 11 (1) 1 (0) 1 (0) 13 (1) Missing 21 (1) 4 (1) 2 (1) 27 (1) Palliative care consultation during index hospitalisation 106 (6) 15 (4) 4 (2) 125 (5) 0.005 Data are presented as mean±sd or n (%), unless otherwise stated. FEV1: forced expiratory volume in 1 s; FVC: forced vital capacity; GOLD: Global Initiative for Chronic Obstructive Lung Disease; LABA: long-acting β-agonist; LAMA: long-acting muscarinic antagonist; ICS: inhaled corticosteroid. #: n=1292; ¶: numbers might not add up as patients are included in the count if they are on an ICS and LABA or LAMA.
- TABLE 2
Deaths and re-hospitalisations in the 12 months following index chronic obstructive pulmonary disease hospitalisation according to level of moderate to vigorous physical activity
Inactive 0 min·week−1 Insufficiently inactive 1–149 min·week−1 Active >150 min·week−1 Total Subjects n 1727 412 231 2370 Deaths# 391 (23) 53 (13) 20 (9) 464 (20) No re-hospitalisation 104 (6) 15 (4) 3 (1) 122 (5) At, during or after re-hospitalisation 287 (17) 38 (9) 17 (7) 342 (14) Re-hospitalisations only 740 (43) 187 (45) 101 (44) 1028 (43) Data are presented as n (%), unless otherwise stated. #: 342 (74%) of all deaths were preceded by a re-hospitalisation.
- TABLE 3
Unadjusted and adjusted Cox proportional hazard regression models predicting mortality 12 months after index chronic obstructive pulmonary disease (COPD) hospitalisation in 2370 patients with COPD
Factor Unadjusted models Adjusted model HR (95% CI) p-value HR (95% CI) p-value Baseline MVPA activity (closest to index hospitalisation) 0 min·week−1 1.0 1.0 1–149 min·week−1 0.54 (0.40–0.72) <0.001 0.72 (0.54–0.97) 0.03 ≥150 mins·week−1 0.35 (0.22–0.55) <0.001 0.53 (0.34–0.84) <0.01 Physical activity assessment time Increase of 1 day prior to index hospitalisation 1.00 (0.99–1.00) 0.89 1.00 (0.99–1.00) 0.91 Age Increase of 1 year 1.05 (1.04–1.06) <0.001 1.04 (1.02–1.05) <0.001 Sex Female versus male 0.82 (0.68–0.98) 0.03 0.76 (0.62–0.93) <0.01 Marital status Single versus partnered 1.21 (0.10–1.46) 0.05 1.04 (0.85–1.27) 0.73 BMI Normal 18.5–24.9 kg·m−2 1.0 1.0 Underweight <18.5 kg·m−2 2.14 (1.64–2.81) <0.001 2.40 (1.82–3.16) <0.001 Overweight 25–29.9 kg·m−2 0.64 (0.50–0.81) <0.001 0.70 (0.54–0.89) <0.01 Obese >30 kg·m−2 0.49 (0.39–0.63) <0.001 0.64 (0.49–0.83) <0.001 Race/ethnicity Non-White versus White 0.84 (0.69–1.03) 0.10 0.95 (0.77–1.17) 0.61 Smoking status Never/passive 1.0 1.0 Former 1.53 (1.11–2.09) 0.01 1.34 (0.97–1.85) 0.07 Current 1.24 (0.86–1.78) 0.25 1.62 (1.10–2.38) 0.01 Medications LABA/ICS or LAMA/ICS versus none 0.90 (0.75–1.08) 0.27 0.87 (0.72–1.06) 0.16 Systemic corticosteroids versus none 1.71 (1.36–2.15) <0.001 1.40 (1.10–1.78) <0.01 Any oxygen use versus none 1.48 (1.22–1.79) <0.001 1.16 (0.95–1.41) 0.15 Hospitalisations Any previous hospitalisations versus none 1.45 (1.21–1.74) <0.001 1.11 (0.91–1.36) 0.31 Comorbidities Charlson index score 0–1 1.0 1.0 2 1.31 (0.90–1.91) 0.16 1.21 (0.82–1.78) 0.34 ≥ 3 2.43 (1.82–3.25) <0.001 1.75 (1.28–2.39) <0.001 Pulmonary hypertension 2.08 (1.67–2.59) <0.001 1.69 (1.34–2.12) <0.001 Depression 1.09 (0.88– .36) 0.44 1.05 (0.84–1.33) 0.65 Pulmonary rehabilitation Yes versus no 0.33 (0.19–0.58) <0.001 0.47 (0.26–0.85) 0.01 Palliative care consultation Yes versus no 4.40 (3.41–5.69) <0.001 1.70 (1.26–2.29) <0.001 Length of stay days 1–2 1.0 1.0 3 1.20 (0.88–1.63) 0.25 1.27 (0.93–1.74) 0.13 4–6 1.69 (1.29–2.20) <0.001 1.60 (1.21–2.09) <0.001 7–13 2.20 (1.62–2.98) <0.001 1.87 (1.35–2.57) <0.001 14–59 3.20 (2.05–4.99) <0.001 2.48 (1.51–4.08) <0.001 Disposition Home 1.0 1.0 Hospice 11.25 (8.39–15.1) <0.001 5.23 (3.74–7.34) <0.001 Post-acute/hospital 2.64 (1.99–3.51) <0.001 1.37 (0.99–1.90) 0.06 Other/missing 2.02 (1.13–3.59) 0.02 1.51 (0.84–2.71) 0.17 The adjusted model included all variables listed in this table. Bold indicates statistical significance. MVPA: moderate to vigorous physical activity; BMI: body mass index; LABA: long-acting β-agonist; ICS: inhaled corticosteroid; LAMA: long-acting muscarinic antagonist.
- TABLE 4
Unadjusted and adjusted Cox proportional hazard regression models predicting the composite outcome of mortality and re-hospitalisations 12 months after index chronic obstructive pulmonary disease (COPD) hospitalisation in 2370 patients with COPD
Factor Unadjusted models Adjusted model HR (95% CI) p-value (HR 95% CI) p-value Baseline MVPA (closest to index hospitalisation) 0 min·week−1 1.0 1.0 1–149 min·week−1 0.80 (0.69–0.92) <0.01 0.85 (0.73–0.97) 0.02 ≥150 min·week−1 0.67 (0.55–0.81) <0.001 0.75 (0.62–0.91) <0.01 Physical activity assessment time Increase of 1 day prior to index hospitalisation 1.0 (0.99–1.00) <0.01 1.0 (0.99–1.00) 0.03 Age Increase of 1 year 1.01 (1.01–1.02) <0.001 1.00 (1.00–1.01) 0.28 Sex Female versus male 0.96 (0.86–1.06) 0.39 0.95 (0.85–1.06) 0.38 Marital status Single versus partnered 1.10 (0.99–1.22) 0.07 1.06 (0.95–1.18) 0.32 BMI Normal 18.5–24.9 kg·m−2 1.0 1.0 Underweight <18.5 kg·m−2 1.20 (0.98–1.47) 0.07 1.27 (1.03–1.55) 0.02 Overweight 25–29.9 kg·m−2 1.01 (0.88–1.15) 0.94 1.01 (0.88–1.15) 0.91 Obese >30 kg·m−2 0.88 (0.78–1.00) 0.05 0.86 (0.75–0.99) 0.04 Race/ethnicity Non-White versus White 1.04 (0.93–1.16) 0.50 1.05 (0.94–1.18) 0.38 Smoking status Never/passive 1.0 1.0 Former 1.12 (0.96–1.31) 0.15 1.05 (0.89–1.23) 0.55 Current 0.84 (0.70–1.01) 0.07 1.00 (0.81–1.22) 0.96 Medications LABA/ICS or LAMA/ICS versus none 1.20 (1.08–1.33) <0.001 1.10 (0.99–1.22) 0.09 Systemic corticosteroids versus none 1.54 (1.34–1.76) <0.001 1.20 (1.04–1.38) <0.01 Any oxygen use versus none 1.13 (1.01–1.26) 0.04 1.02 (0.91–1.14) 0.80 Hospitalisations Any previous hospitalisations versus none 1.72 (1.55–1.90) <0.001 1.45 (1.30–1.63) <0.001 Comorbidities Charlson index 0–1 1.0 1.0 2 1.34 (1.11–1.60) <0.01 1.21 (1.01–1.46) 0.04 ≥3 1.85 (1.61–2.14) <0.001 1.50 (1.28–1.75) <0.001 Pulmonary hypertension 1.52 (1.32–1.75) <0.001 1.23 (1.07–1.42) <0.001 Depression 1.13 (1.00–1.28) 0.05 1.02 (0.89–1.15) 0.82 Pulmonary rehabilitation Yes versus none 0.99 (0.81–1.20) 0.89 1.00 (0.82–1.23) 0.97 Palliative care consultation Yes versus no 1.80 (1.47–2.20) <0.001 1.19 (0.95–1.49) 0.14 Length of stay days 1–2 1.0 1.0 3 1.03 (0.88–1.20) 0.71 1.04 (0.89–1.22) 0.59 4–6 1.31 (1.15–1.51) <0.001 1.24 (1.08–1.43) <0.001 7–13 1.47 (1.24–1.74) <0.001 1.33 (1.11–1.58) <0.001 14–59 2.07 (1.56–2.75) <0.001 1.71 (1.26–2.32) <0.001 Disposition Home 1.0 1.0 Hospice 2.56 (1.96–3.35) <0.001 1.74 (1.30–2.33) <0.001 Post-acute/hospital 1.41 (1.16–1.72) <0.001 1.14 (0.92–1.41) 0.22 Other/missing 1.06 (0.71–1.59) 0.78 1.03 (0.69–1.56) 0.87 The adjusted model included all variables listed in this table. Bold indicates statistical significance. MVPA: moderate to vigorous physical activity; BMI: body mass index; LABA: long-acting β-agonist; ICS: inhaled corticosteroid; LAMA: long-acting muscarinic antagonist.
- TABLE 5
Sensitivity analyses for the primary outcome of mortality
Factor Subjects n Adjusted model p-value HR (95% CI) Baseline MVPA (closest to index hospitalisation) Patients with spirometry#,¶ 1292 0 min·week−1 1.0 1–149 min·week−1 0.88 (0.60–1.28) 0.50 ≥150 min·week−1 0.53 (0.28–1.01) 0.06 Patients with smoking history# 2066 0 min·week−1 1.0 1–149 min·week−1 0.71 (0.52–0.97) 0.03 ≥150 min·week−1 0.57 (0.35–0.90) 0.02 Any MVPA# (closest to index hospitalisation) 2370 0 min·week−1 1.0 ≥1 min·week−1 0.66 (0.51–0.85) <0.001 Median/mode MVPA+ 2370 0 min·week−1 1.0 1–149 min·week−1 0.61 (0.43–0.88) <0.01 ≥150 min·week−1 0.62 (0.37–1.03) 0.07 Highest MVPA§ 2370 0 min·week−1 1.0 1–149 min·week−1 0.69 (0.55–0.85) <0.001 ≥150 min·week−1 0.59 (0.47–0.76) <0.001 Cox regression models adjusted for age, marital status, race/ethnicity, body mass index, smoking status, disease severity (medications, oxygen use, Charlson comorbidity index, pulmonary hypertension, depression, any hospitalisation in previous 12 months), ever attended pulmonary rehabilitation in the 3 years prior to the index hospitalisation, palliative care consultation during the index hospitalisation, length of stay, discharge disposition and duration of time from assessment of physical activity to index hospitalisation. MVPA: moderate to vigorous physical activity. #: included on indicated models; ¶: forced expiratory volume in 1s % predicted was included in the adjusted model and was not a significant predictor of death; +: based on all physical activity readings over 12 months prior to index hospitalisation; §: highest physical activity reading over 12 months prior to index hospitalisation.


