


Figures
- FIGURE 1
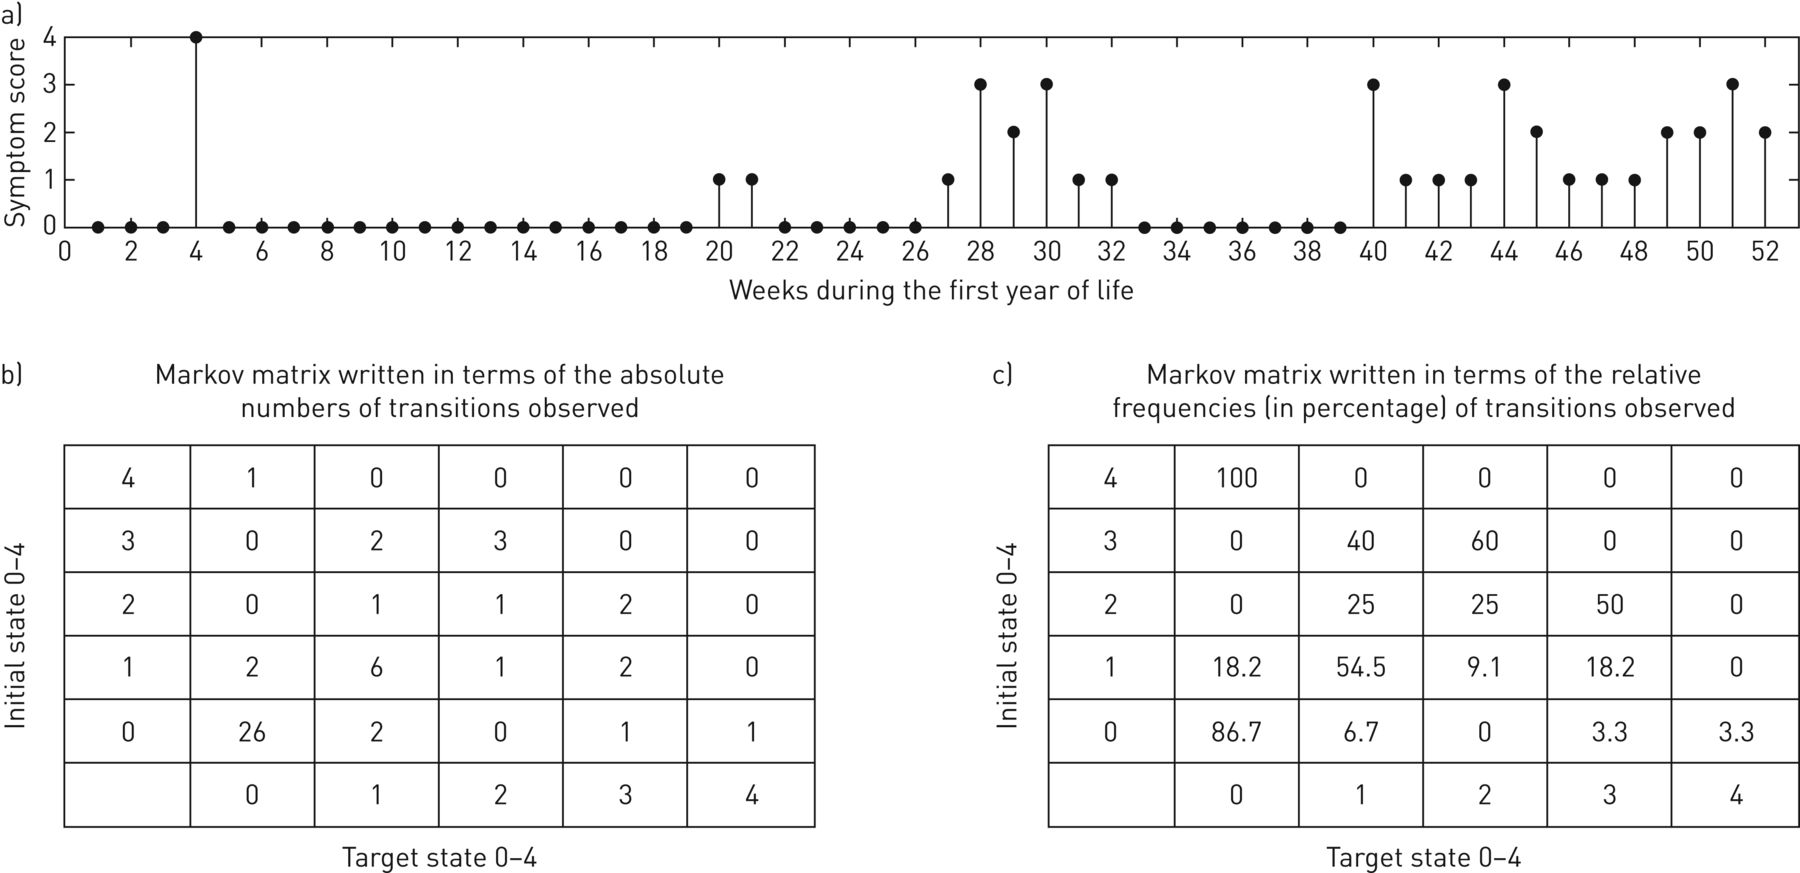
Distribution of respiratory symptom states during infancy of one infant and corresponding Markov matrices. Panel (a) shows the Temporal pattern of respiratory symptom scores during the first year of life for one infant. We assessed transitions between different levels of the symptom scores (state 0: healthy state, symptom score 0; states 1–4: symptomatic states, symptom scores 1–4). For each symptom state (i.e. initial state, 1st time point), we counted how often a transition to any other state (i.e. target state, 2nd time point) occurred, as assessed during the subsequent week. This count information is displayed in a 5×5 matrix. Absolute values are displayed in panel (b), whereas the corresponding relative frequencies are displayed in panel (c).
- FIGURE 2
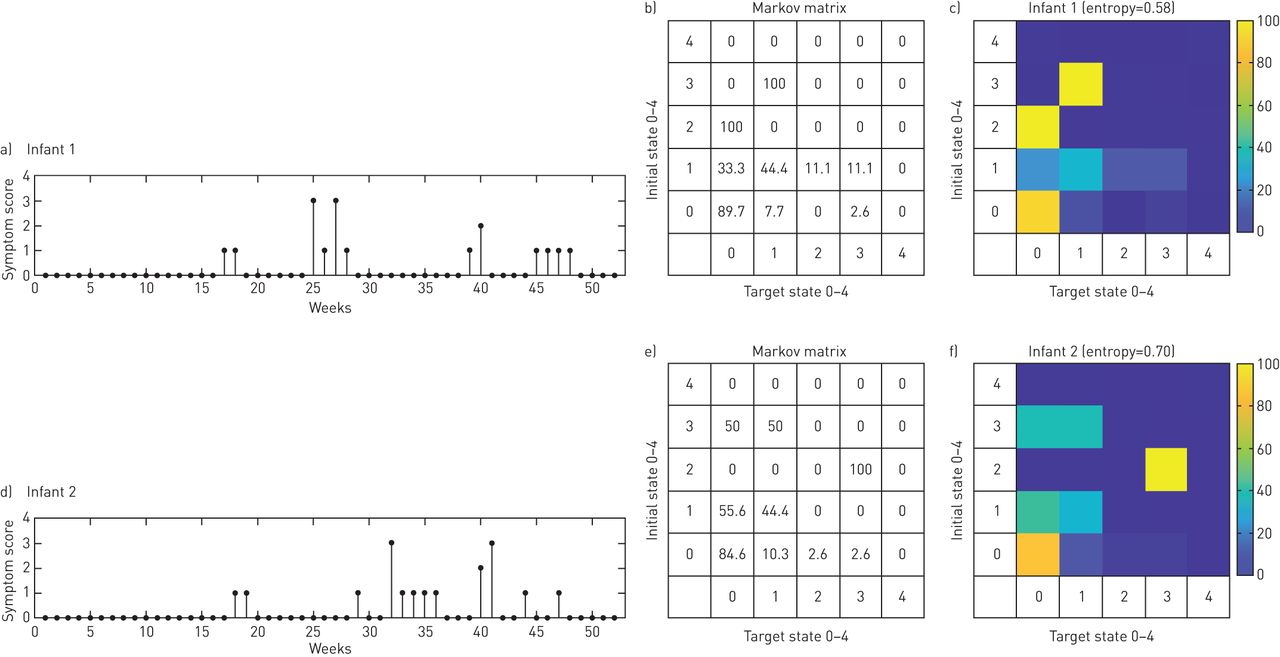
Representative Markov matrix patterns of two infants. Panel (a) (infant 1) and panel (d) (infant 2) show the weekly respiratory symptom scores (states 0–4) during the first year of life. The total number of “weeks with respiratory symptoms” during the first year for both infants were the same (37 weeks symptom score 0, 9 weeks symptom score 1, 1 week symptom score 2 and 2 weeks symptom score 3). The Markov matrices in panel (b) (infant 1) and panel (e) (infant 2) show the empirical probability of each transition (described in the methods and figure 1). In panels (c) and (f), the colours correspond to the empirical probability of each transition. The pattern of the Markov matrix landscape was expressed using a single average entropy parameter [16] (described in the supplementary material), which was 0.58 for infant 1 and 0.70 for infant 2.
- FIGURE 3
Respiratory symptom transitions of all study participants. The vertical-axis represents the number of transitions (in weeks) observed during the first year of life. The horizontal-axis represents all possible transitions (Type 1: healthy state; Type 2: increasing symptoms; Type 3: stable symptoms; Type 4: decreasing symptoms). Data are shown as box plots, while the numbers in brackets indicate initial symptom score (initial state) and target symptom score (target state), as assessed in the subsequent week.


Tables
- TABLE 1
Respiratory symptom score and associated day and night-time symptoms
Symptom score Symptoms (cough, wheeze, or breathing difficulty) Day time Night time 0 None None 1 Slight; no treatment given Slight; sleep not disturbed 2 Required treatment but no outside help Sleep disturbed once; no help required 3 Severe; required help from GP Sleep disturbed more than once or child needed help 4 Very severe; admitted to hospital Sleep very disturbed or GP called GP: general practitioner. Reproduced from [15] with permission from the publisher.
- TABLE 2
Characteristics of the study population
n (%) Mean±sd Median (IQR) Range Anthropometric data at birth Gestational age weeks 39.6±1.2 39.8 (38.8–40.5) 36.7–41.8 Birth weight kg 3.3±0.4 3.3 (3.0–3.6) 2.1–4.9 Length cm 49.5±1.9 50.0 (48–51) 44–57 Respiratory symptoms in the first year of life Weeks with symptoms 5.3±4.6 4 (0–20) 0–23 Weeks with severe symptoms 0.71±1.1 0 (0–1) 0–6 Risk factors Male sex 167 (51.8) Siblings 159 (49.4) Caesarean section 54 (16.7) Maternal asthma 34 (10.5) Maternal atopy 116 (36.1) Childcare 62 (19.5) Maternal smoking in pregnancy 27 (8.4) Parental smoking during infancy 70 (21.7) Breastfeeding >26 weeks 252 (78.3) Low maternal education 202 (62.7) Season of birth Spring 87 (27.4) Summer 83 (25.7) Autumn 80 (24.8) Winter 72 (22.6) Outcomes at 6 year follow-up Any wheezing# 105 (32.9) Current wheezing¶ 38 (11.7) Atopic disease+ 120 (37.5) SPT positive§ 37 (13.6) Data are derived from 322 infants with a total of 16 864 observed symptom weeks. IQR: interquartile range; SPT: skin-prick test. #: defined as any wheezing episode between one and 6 years of age; ¶: defined as wheezing over the past 12 months before follow-up; +: defined as allergic rhinitis, allergic asthma, or atopic dermatitis before follow-up; §: a SPT was completed in a subset of 270 children.
- TABLE 3
Characteristics of symptom dynamic phenotypes and reference phenotypes
Phenotype 1 Phenotype 2 Phenotype 3 p-value Dynamic (n=145) Reference (n=147) Dynamic (n=135) Reference (n=128) Dynamic (n=42) Reference (n=47) Dynamic Reference Respiratory symptoms Weeks with severe symptoms 0.22±0.43 0.14±0.37 0.82±1.03 0.87±0.98 2.11±1.64 2.14±1.53 <0.001 <0.001 Weeks with any symptoms 1.84±1.58 1.57±1.09 7.03±3.64 6.61±1.96 12.19±3.56 13.87±3.03 <0.001 <0.001 Respiratory symptoms transition states Entropy of transition states 0.08±0.05 0.13±0.16 0.56±0.14 0.54±0.25 1.03±0.12 0.91±0.23 <0.001 <0.001 Risk factors Male sex 50.3 43.5 49.6 56.3 64.3 65.9 0.223 0.012 Siblings 37.2 38.1 57.1 53.9 66.7 72.4 <0.001 <0.001 Caesarean section 24.8 23.8 10.4 10.2 9.5 12.7 0.002 0.008 Maternal asthma 9.6 8.8 9.6 10.2 16.7 17.1 0.385 0.278 Maternal atopy 37.2 33.3 34.8 35.9 35.7 44.7 0.914 0.370 Childcare 13.7 11.5 19.3 20.3 38.1 40.4 0.006 <0.001 Maternal smoking during pregnancy 7.6 6.8 8.2 10.2 11.9 8.5 0.668 0.606 Parental smoking during infancy 24.8 23.1 15.5 20.3 30.9 21.3 0.051 0.805 Breastfeeding ≤26 weeks 21.4 20.4 21.5 23.4 23.8 21.3 0.941 0.829 Low maternal education 64.1 61.9 62.2 64.1 59.5 61.7 0.851 0.983 Season of birth Spring 25.5 26.5 31.1 27.3 19.1 27.7 0.264 0.983 Summer 22.1 18.4 27.4 35.9 33.3 21.3 0.289 0.003 Autumn 35.8 35.4 16.3 15.6 14.3 17.1 <0.001 <0.001 Winter 16.5 19.7 25.2 21.1 33.3 34.1 0.042 0.111 Outcomes at 6 year follow-up Any wheezing# 27.6 22.4 28.9 38.3 64.3 51.1 <0.001 <0.001 Current wheezing¶ 9.6 8.8 9.6 11.7 26.2 21.3 0.008 0.071 Atopic disease+ 35.4 36.3 37.1 39.4 46.3 36.2 0.449 0.855 SPT positive§ 13.3 14.5 12.3 13.1 19.4 13.2 0.545 0.942 Data are presented as % or mean±sd. Symptom dynamic phenotypes were defined by the average entropy of transition states and reference phenotypes by weeks with any respiratory symptom. Differences in the distribution of characteristics across phenotypes were assessed using Chi-squared tests for categorical variables and Kruskal–Wallis tests for continuous variables. Significant p-values at the Bonferroni-corrected α-level of 0.017 are shown in bold. SPT: skin-prick test. #: defined as any wheezing episode between one and 6 years of age; ¶: defined as wheezing over the past 12 months before follow-up; +: defined as allergic rhinitis, allergic asthma, or atopic dermatitis before follow-up; §: a SPT was completed in a subset of 270 children.
- TABLE 4
Association of symptom dynamic phenotypes, reference phenotypes and risk factors with outcomes during childhood
Outcome Univariable association Multivariable association# OR 95% CI p-value OR 95% CI p-value Any wheezing between one and 6 years¶ (n=105/322) Reference phenotypes Phenotype 1 (baseline; n=147) 1 Reference 1 Reference Phenotype 2 (n=128) 2.14 1.26–3.62 0.005 1.93 1.11–3.35 0.019 Phenotype 3 (n=47) 3.61 1.81–7.19 <0.001 2.84 1.32–6.11 0.008 Symptom dynamic phenotypes Phenotype 1 (baseline; n=145) 1 Reference 1 Reference Phenotype 2 (n=135) 1.07 0.63–1.79 0.809 1.06 0.61–1.84 0.830 Phenotype 3 (n=42) 4.72 2.27–9.72 <0.001 4.31 1.95–9.48 <0.001 Risk factors Male sex 3.05 1.86–5.01 <0.001 2.90 1.75–4.81 <0.001 Siblings 1.22 0.77–1.95 0.386 1.27 0.78–2.09 0.328 Maternal asthma 2.23 1.09–4.58 0.028 2.16 1.03–4.55 0.041 Childcare 1.49 0.84–2.64 0.169 1.40 0.75–2.59 0.284 Parental smoking during infancy 1.08 0.61–1.89 0.783 0.99 0.55–1.81 0.995 Low maternal education 1.23 0.76–2.01 0.391 1.13 0.66–1.93 0.644 Current wheezing at 6 years+ (n=38/322) Reference phenotypes Phenotype 1 (baseline; n=147) 1 Reference 1 Reference Phenotype 2 (n=128) 1.36 0.62–2.99 0.433 1.22 0.54–2.75 0.618 Phenotype 3 (n=47) 2.78 1.13–6.86 0.026 2.25 0.83–6.11 0.110 Symptom dynamic phenotypes Phenotype 1 (baseline; n=145) 1 Reference 1 Reference Phenotype 2 (n=135) 0.99 0.45–2.21 0.994 1.01 0.44–2.31 0.968 Phenotype 3 (n=42) 3.32 1.37–8.01 0.008 3.01 1.15–7.88 0.025 Risk factors Male sex 2.52 1.21–5.28 0.014 2.26 1.06–4.81 0.033 Siblings 1.15 0.58–2.28 0.670 1.19 0.61–2.42 0.616 Maternal asthma 1.71 0.65–4.45 0.141 1.66 0.62–4.41 0.306 Childcare 1.35 0.61–3.02 0.462 1.38 0.58–3.27 0.457 Parental smoking during infancy 1.33 0.61–2.89 0.468 1.15 0.51–2.59 0.723 Low maternal education 1.77 0.82–3.78 0.141 1.63 0.73–3.66 0.229 Atopic disease at 6 years§ (n=120/320) Reference phenotypes Phenotype 1 (baseline; n=146) 1 Reference 1 Reference Phenotype 2 (n=127) 1.13 0.69–1.86 0.602 1.06 0.63–1.78 0.824 Phenotype 3 (n=47) 0.99 0.51–1.97 0.987 0.89 0.41–1.91 0.772 Symptom dynamic phenotypes Phenotype 1 (baseline; n=144) 1 Reference 1 Reference Phenotype 2 (n=135) 1.07 0.65–1.74 0.778 1.12 0.66–1.88 0.667 Phenotype 3 (n=41) 1.57 0.78–3.17 0.205 1.74 0.81–3.77 0.159 Risk factors Male sex 2.15 1.35–3.42 0.001 2.10 1.29–3.40 0.003 Siblings 1.09 0.69–1.72 0.686 1.01 0.63–1.63 0.944 Maternal asthma 1.55 0.76–3.18 0.226 1.51 0.72–3.17 0.274 Childcare 0.62 0.34–1.14 0.127 0.63 0.33–1.21 0.168 Parental smoking during infancy 1.09 0.63–1.88 0.752 0.92 0.55–1.64 0.786 Low maternal education 2.30 1.40–3.77 0.001 2.03 1.20–3.41 0.008 Logistic regression analysis was carried out for the outcomes any wheezing, current wheezing and atopic disease. Symptom dynamic phenotypes were defined by average entropy of transition states and reference phenotypes by weeks with any respiratory symptom. When considering phenotypes as exposure, phenotype 1 from the reference phenotype or symptom dynamic phenotype, respectively, served as baseline. OR: odds ratio. #: adjusted for the binary variables male gender, low maternal education, maternal asthma, maternal smoking during pregnancy, childcare attendance during infancy and presence of siblings; ¶: defined as any wheezing episode between one and 6 years of age; +: defined as wheezing over the past 12 months before follow-up; §: defined as allergic rhinitis, allergic asthma, or atopic dermatitis before follow-up.
Supplementary Material
Please note: supplementary material is not edited by the Editorial Office, and is uploaded as it has been supplied by the author.
ONLINE SUPPLEMENT 00037-2018_supp


