


Figures
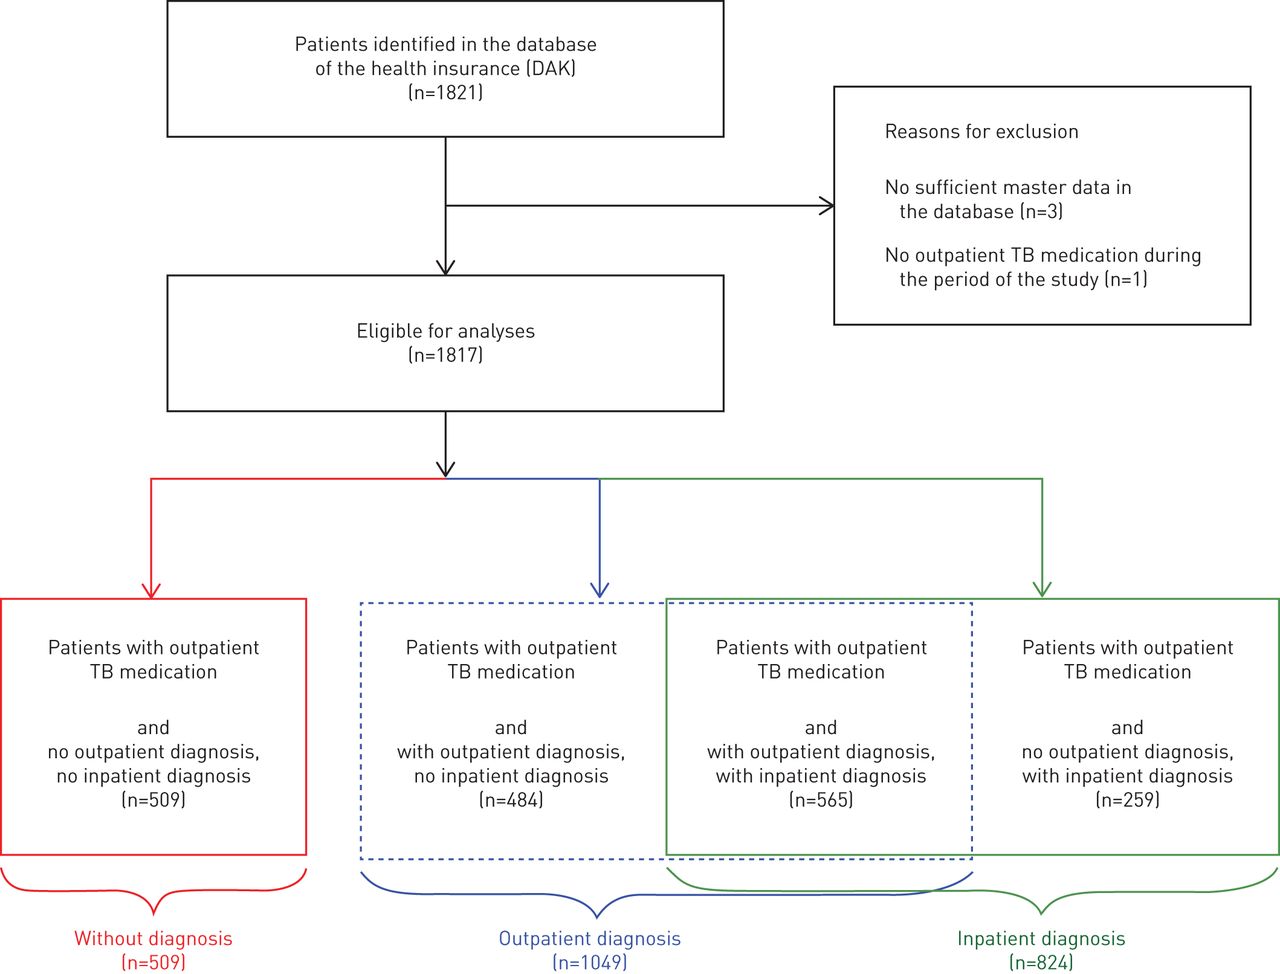
- FIGURE 1
Composition of the study population (n=1817). TB: tuberculosis.
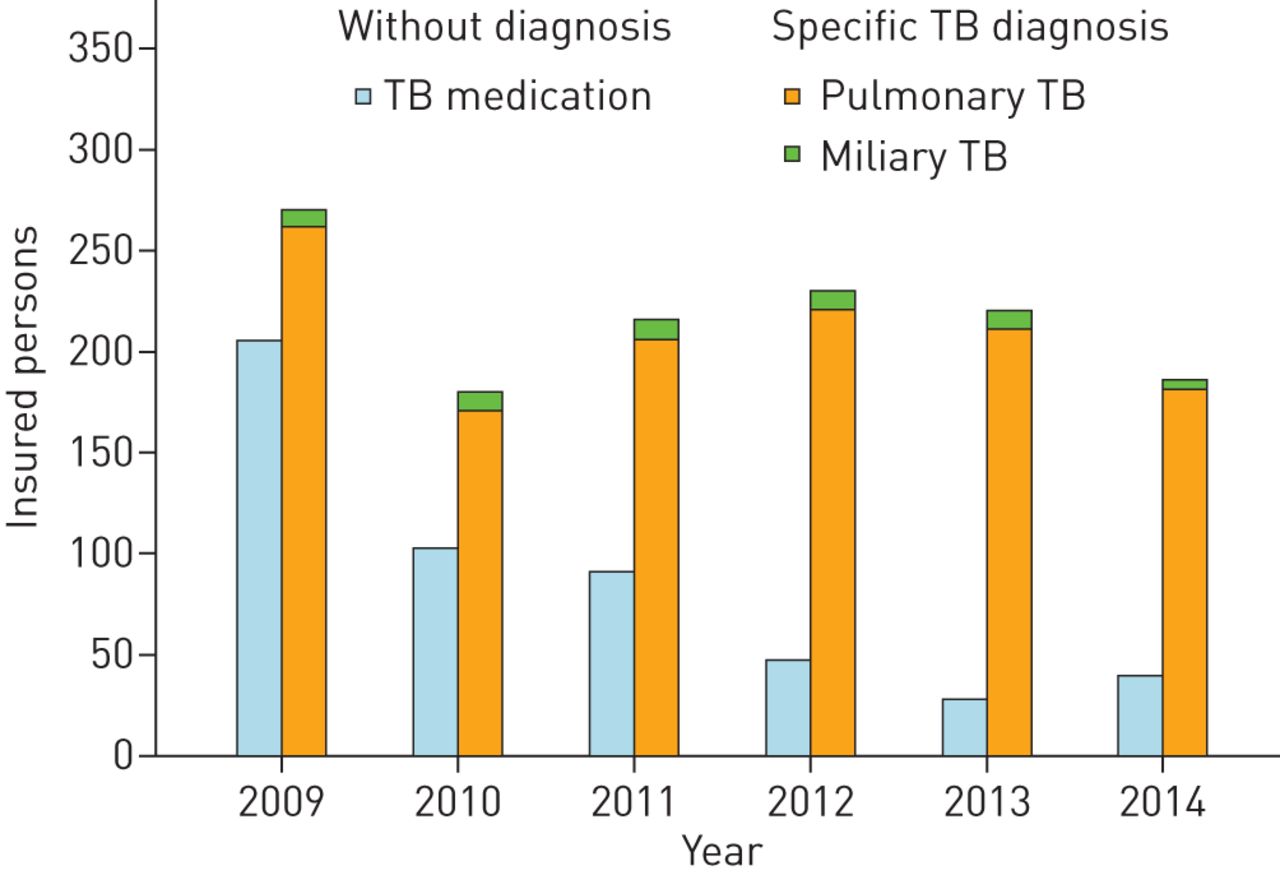
- FIGURE 2
Year of the first diagnosis or first medication with specific anti-tuberculosis (TB) drugs (n=1817).
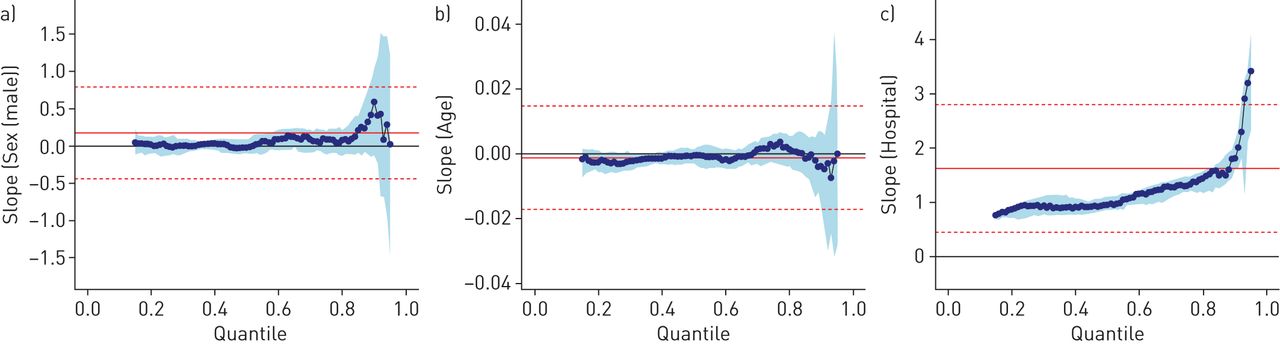
- FIGURE 3
Quantile regression for the reference measure rifampicin (defined daily doses per day) on the variables (a) sex, (b) age and (c) hospital discharge (n=727). Blue points represent the estimators for the particular quantile of the drug dose that was available per day. The light blue areas highlight the corresponding 95% confidence intervals. Useful for comparison is the solid red line representing the constant estimation of a standard regression model.
- FIGURE 4
Quantile regression for the reference measure isoniazid (defined daily doses per day) on the variables (a) sex, (b) age and (c) hospital discharge (n=727). Blue points represent the estimators for the particular quantile of the drug dose that was available per day. The light blue areas highlight the corresponding 95% confidence intervals. Useful for comparison is the solid red line representing the constant estimation of a standard regression model.

Tables
- TABLE 1
Sociodemographic data of included patients
Variable Women
n (row percentage)Men
n (row percentage)Overall
n (column percentage)Sex n (rate) 896 (49.3%) 921 (50.7%) 1817 (100%) Age# years Mean±sd 51.8±23.3 51.0±23.7 51.4±23.5 Median (range) 56 (0–93) 54 (0–92) 55 (0–93) ICD-10 diagnosis (3-digit) A15 (confirmed respiratory TB) 263 (46.6%) 301 (53.4%) 564 (31.4%) A16 (unconfirmed respiratory TB) 439 (48.8%) 461 (51.2%) 900 (49.5%) A19 (miliary TB) 27 (54.0%) 23 (46.0%) 50 (2.8%) Death, unknown cause Number 105 (35.1%) 194 (64.9%) 299 (16.5%) Age years Mean±sd 74.1±11.7 72.8±11.7 73.2±11.7 Median (range) 76 (35–93) 74 (23–92) 75 (23–93) Work incapacity certificate (reason: A15, A16, A19) Number of cases of work incapacity¶ 58 (45.3%) 70 (54.7%) 128 (7.0%) Work incapacity period days Mean±sd 141.0±137.4 133.0±134.9 136.6±135.5 Median (range) 113.5 (1–550) 98 (2–547) 99.5 (1–550) Number of cases of work incapacity involving disease of the respiratory system+ 167 (49.1%) 173 (50.9%) 340 (18.7%) TB as main diagnosis upon hospital discharge 344 (41.7%) 480 (58.3%) 824 (45.3%) TB as outpatient diagnosis 287 (47.7%) 315 (52.3%) 602 (33.1%) TB: tuberculosis. #: Age upon initial TB diagnosis/TB drug treatment in the period from 2009 to 2014. The age curve of the insurance holders is shown by a bar plot in figure S3; ¶: work incapacity certificates for the ICD-10 TB diagnoses: A15, A16, A19; +: work incapacity certificates for the ICD-10 diagnoses of TB or disease of the respiratory system.
- TABLE 2
Number of outpatient prescription-defined daily doses for tuberculosis drugs for the years 2009 to 2014 (n=1817)
Active ingredient (number of patients) Year 2009 2010 2011 2012 2013 2014 First-line drugs Isoniazid (n=1563) 64 358 50 100 52 400 52 375 45 383 45 025 Rifampicin (n=1458) 54 860 46 979 47 921 43 131 37 340 39 152 Ethambutol (n=1110) 23 498 22 650 24 687 21 783 18 638 17 438 Pyrazinamide (n=991) 15 127 12 713 11 007 11 650 10 533 10 850 Second-line drugs Protionamide (n=18) 333.3 666.7 616.7 183.3 183.3 116.7 Amikacin (n=9) 0 10 47.5 0 5 70 Aminosalicylic acid (n=1) 0 0 0 0 0 19.3 Delamanid (n=1) 0 0 0 0 0 10 Rifabutin (n=96) 3960 5190 6420 6030 6180 4860 Terizidone (n=5) 14.3 28.6 0 157.1 71.4 0 Streptomycin (n=14) 160 50 20 100 0 0 Bedaquiline (n=0) 0 0 0 0 0 0 Moxifloxacin (n=304) 779 1376 2003 1578 1698 1245 Levofloxacin (n=363) 938.5 1239 1145 1133.5 1049.5 768.5 - TABLE 3
Defined daily doses per medication day (difference: last prescription, first prescription with n=727 insurance holders having at least two redeemed prescriptions for tuberculosis drugs under study)
Active ingredient (patients) Minimum 1st quartile Median Mean 3rd quartile Maximum First-line drugs Isoniazid (n=640) 0.034 0.906 1.527 2.536 2.263 133.334 Rifampicin (n=641) 0.026 0.791 1.359 2.380 2.198 130.000 Ethambutol (n=532) 0.011 0.309 0.595 1.090 0.951 45.834 Pyrazinamide (n=527) 0.018 0.293 0.514 1.007 0.851 66.666 Second-line drugs Protionamide (n=7) 0.017 0.082 0.441 1.104 0.989 5.128 Amikacin (n=4) 0.033 0.104 0.130 0.362 0.387 1.154 Aminosalicylic acid (n=1) 0.254 0.254 0.254 0.254 0.254 0.254 Delamanid (n=1) 0.132 0.132 0.132 0.132 0.132 0.132 Rifabutin (n=25) 0.047 0.526 0.737 1.448 1.826 7.826 Terizidone (n=4) 0.044 0.070 0.144 0.174 0.248 0.365 Streptomycin (n=10) 0.010 0.054 0.082 1.952 0.148 20.000 Bedaquiline (n=0) 0.000 0.000 0.000 0.000 0.000 0.000 Moxifloxacin (n=144) 0.004 0.040 0.098 0.352 0.228 7.500 Levofloxacin (n=165) 0.003 0.041 0.082 0.179 0.161 2.857 - TABLE 4
Comorbidity among insurance holders (multiple assignments possible)
Comorbidity# No hospital stay due to TB n (row percentage) Hospital stay due to TB n (row percentage) Number (proportion of total population) Diabetes mellitus 105 (30.9%) 235 (69.1%) 340 (18.7%) HIV 9 (23.1%) 30 (76.9%) 39 (2.1%) Renal failure 52 (16.9%) 256 (83.1%) 308 (17.0%) Alcoholism 54 (28.7%) 134 (71.3%) 188 (10.3%) Crohn's disease 15 (39.5%) 23 (60.5%) 38 (2.1%) Antibiotic resistance 7 (17.9%) 32 (82.1%) 39 (2.1%) Patients with at least one comorbidity# 168 (22.9%) 565 (77.1%) 733 (40.3%) Patients with no known comorbidity# 825 (76.1%) 259 (23.9%) 1084 (59.7%) #: These are the only comorbidities that were reported in the main hospital discharge diagnoses during the period from 2009 to 2014 or confirmed outpatient diagnoses in the period from 2012 to 2014.
- TABLE 5
Univariate group differences for selected risk factors in relation to hospital stay duration and tuberculosis drug treatment duration
Comorbidity# Comorbidity effect difference days Additional hospital stay duration of hospitalised patients (n=824) Additional drug treatment duration (n=1817) Diabetes mellitus −0.3 (p=0.981) 4.6 (p=0.766) HIV 25.3 (p=0.399) 111.9 (p=0.007)** Renal failure −3.7 (p=0.761) 14.8 (p=0.353) Alcoholism 48.0 (p<0.001)*** 14.6 (p=0.456) Crohn's disease −32.2 (p=0.402) 77.1 (p=0.065) Antibiotic resistance 63.2 (p=0.016)* 70.1 (p=0.093) Patients with at least one comorbidity 27.2 (p=0.003)** 25.0 (p=0.040)* #: These are only comorbidities that were reported in the main hospital discharge diagnoses during the period from 2009 to 2014 or confirmed outpatient diagnoses in the period from 2012 to 2014; *: p<0.05; **: p<0.01; ***: p<0.001.
- TABLE 6
Hospital stay durations and drug treatment durations in relation to sociodemographic factors and diagnoses, each compared to the rest of the population
Variable Effect difference days Additional hospital stay duration of hospitalised patients (n=824) Additional drug treatment duration (n=1817) Age >64 years 4.4 (p=0.603) −5.1 (p=0.479) Sex male 1.5 (p=0.855) −21.6 (p=0.002)** Diagnosed pulmonary TB 7.0 (p=0.411) 42.5 (p<0.001)*** Diagnosed miliary TB 34.9 (p=0.001)** 117.4 (p=0.009)** TB: tuberculosis. **: p<0.01; ***: p<0.001.
Supplementary Material
Please note: supplementary material is not edited by the Editorial Office, and is uploaded as it has been supplied by the author.
Figure S1 00369-2019.figureS1
Figure S2 00369-2019.figureS2
Figure S3 00369-2019.figureS3


