Article Text

Abstract
Introduction Some patients with obstructive sleep apnoea syndrome are at higher risk of being involved in road traffic accidents. It has not been possible to identify this group from clinical and polysomnographic information or using simple simulators. We explore the possibility of identifying this group from variables generated in an advanced PC-based driving simulator.
Methods All patients performed a 90 km motorway driving simulation. Two events were programmed to trigger evasive actions, one subtle and an alert driver should not crash, while for the other, even a fully alert driver might crash. Simulator parameters including standard deviation of lane position (SDLP) and reaction times at the veer event (VeerRT) were recorded. There were three possible outcomes: ‘fail’, ‘indeterminate’ and ‘pass’. An exploratory study identified the simulator parameters predicting a ‘fail’ by regression analysis and this was then validated prospectively.
Results 72 patients were included in the exploratory phase and 133 patients in the validation phase. 65 (32%) patients completed the run without any incidents, 45 (22%) failed, 95 (46%) were indeterminate. Prediction models using SDLP and VeerRT could predict ‘fails’ with a sensitivity of 82% and specificity of 96%. The models were subsequently confirmed in the validation phase.
Conclusions Using continuously measured variables it has been possible to identify, with a high degree of accuracy, a subset of patients with obstructive sleep apnoea syndrome who fail a simulated driving test. This has the potential to identify at-risk drivers and improve the reliability of a clinician's decision-making.
- Sleep apnoea
Statistics from Altmetric.com
Key messages
What is the key question?
Is it possible to identify a group of patients with obstructive sleep apnoea syndrome (OSAS) who are potentially at risk of being involved in road traffic accidents using an advanced office-based driving simulator?
What is the bottom line?
It is possible to identify with a high degree of accuracy a subset of patients with OSAS who are likely to fail a simulated driving scenario, in a way that has ‘street credibility’ using continuously recorded data from the simulator.
Why read on?
Using subtle parameters of which the subjects remain unaware, this simulator provides hope for a much needed objective test to help clinicians advise patients with OSAS about driving.
Introduction
On average, patients with obstructive sleep apnoea syndrome (OSAS) are at increased risk of being involved in a road traffic accident, but not all patients with OSAS are unsafe drivers. Currently advice about an individual's fitness to drive is based on the severity of the sleep-disordered breathing and daytime sleepiness, and their account of their driving.1–4 Although there is a trend towards increased likelihood of accidents with more severe sleep-disordered breathing, these are not sufficiently robust data on which to base decisions for an individual.5 There are conflicting data about the relationship between perceived sleepiness and the likelihood of being involved in an accident6 ,7 and between subjective and objective tests for increased daytime sleepiness.8–10 Driving requires alertness and also complex integrated higher cortical function; patients with OSAS may have neurological damage, which may impact on driving.11 Driving may therefore be impaired for reasons other than those just related to maintenance of alertness. The advice that a patient will receive about driving will also depend on their doctor's attitude to risk and this is likely to be inconsistent in the absence of robust objective criteria. There is therefore a need for an objective test, which can help to inform the advice that clinicians give to patients with OSAS.
Any such test should evaluate as many aspects as possible of all the functions needed for safe driving, and not just alertness. Performing studies during real driving is not feasible. PC-based driving simulators provide objective data and previous studies have shown that patients with OSAS tend to perform worse than normal subjects on driving simulators, but there is considerable overlap.12–14 Performance on the simulator improves with continuous positive airways pressure (CPAP).13 ,15–21 Most of these studies used simple simulators with graphics which were not very realistic and the simulators have not been validated against real driving. Furthermore, subjects perform in such a way that raises questions of credibility, for example, multiple crashes and off-road events during a short run, about the relationship to real driving.14 ,19 This relationship is key if simulators are to be used in advising whether an individual is fit to drive. Fully immersive simulators are close to real driving but are expensive, only available in a few research centres.
The Institute for Transport Studies at the University of Leeds, UK has developed a sophisticated fully immersive driving simulator (UoLDS). This is a full size car with complex audiovisuals providing a realistic driving experience. The ‘car’ moves and feels real as if it is slowing down, accelerating etc. Driving simulators will never fully replicate the real driving experience, although studies have shown that there is a good correlation at the performance level.22 Driving simulators offer an alternative environment in which to study driving behaviour and hence inform road safety policy.
Alongside the full-scale simulator, a PC-based simulator (MiniSim) has been developed using the same software. The MiniSim, provides realistic graphics, incorporates steering and foot pedals and, like the UoLDS, allows continuous measurement of variables, which have been shown to relate to driver performance.22 ,23
Because patients may need to perform the simulator test on more than one occasion and/or may be able to ‘raise their game’ if they know that their licence is at risk, it would be an advantage to assess driving performance using measures of which the patient is unaware. Therefore we have evaluated whether variables that are recorded continuously and unobtrusively on the MiniSim are associated with a one-off event that is credible as being indicative of poor driving.
Methods
The study was conducted at St James's University Hospital, Leeds, UK. Ethical approval was obtained from the local NHS Research Ethics Committee.
Patients
Patients attending the Sleep Clinic with a confirmed diagnosis of OSAS (apnoea hypopnoea index and/or oxygen desaturation index (ODI-4% dips in saturation) >10/h) on respiratory variable overnight sleep study (Embletta, Medcare Flaga, Reykjavik, Iceland) or overnight oximetry were approached. Recruitment was biased towards patients considered for a trial of CPAP therapy. This was to generate a patient population at risk of road traffic accident and likely to have ‘events’ on the simulator.
Driving simulator (MiniSim)
Road layout and scenario
A 90 km three-lane motorway was developed with UK standard lane markings and signage. The road is composed of eight sections (each 9 km in length). One section of motorway takes approximately 7 min to drive (at 70 mph) and will be referred to as one epoch. All subjects had the procedures explained and had a four-epoch practice session before commencing the test proper. A ‘minor’ or ‘veer’ event was choreographed within epoch 4 of the test run; a vehicle swerves briefly into the driver's lane, requiring an avoidance manoeuvre such as braking or swerving (or both). The vehicle is sufficiently far ahead that an alert driver should easily be able to avoid a collision. Throughout the drive, vehicles manoeuvre in and out of the subjects' lane and they react to them as they would in real life. The ‘minor’ event is an extension of these manoeuvres. A ‘major’ or ‘brake’ event was inserted into epoch 8 and this also signalled the end of the run. Here, a vehicle ahead brakes heavily; even with full attention some subjects might not avoid a crash.
Measures and endpoints
Task failure was defined as hitting another vehicle, veering completely out of lane (except in response to an event) or spending more than 5% of the total study time (2.5 min) with two wheels out of the middle lane. There were four possible outcomes of the simulator runs; task failure unprovoked during the study; crashing into the vehicle in front at the ‘veer’ event; crashing into the vehicle in front only at the major event; no task failure at any time during the study run. Unprovoked task failure and crashes at the minor event should not happen during simulated driving and these subjects were considered to have ‘failed’ the test. Subjects who completed the test without meeting any of the task failure criteria defined above were deemed to have ‘passed’. The subjects who only crashed at the ‘brake’ event were deemed to be ‘indeterminate’.
The MiniSim recorded continuous measures of driving behavior, such as time it would take to collide into the lead vehicle were it to stop dead (minimum time headway, Hw), percentage time spent with minimum headway of <1 s (Hw1s), minimum time to collision (TTC) to the preceding vehicle, high-frequency steering (HFS), mean speed, standard deviation of lane position (SDLP), lane changes. For the purpose of analysis we used the mean values for each parameter in epochs 3, 5, 6 and 7, which were free of events and just require steady driving at approximately 70 mph. In addition, specific measures at the programmed events were also recorded, including speed on approach to collision and reaction times (RTs).
Study design and analysis
The study was divided into two phases. In the first phase we explored whether any of the continuous (eg, SDLP, HFS, TTC, Hw1s) and event specific (eg, RT) simulator variables recorded could predict the outcomes on the MiniSim. We compared these measures of driving performance between different categories of patients using one-way analysis of variance and t tests with Bonferroni's multiple testing correction. Binary logistic regression analysis was used to test the hypothesis that a ‘fail’ could be predicted from continuous measures of driving behaviour and thereby explore the possibility of developing a predictive model. Receiver operating characteristic (ROC) curve analyses were performed to calculate the discriminative power of the models and identify optimal cutoffs for probability score. The sensitivity, specificity and predictive powers of the models were calculated using the cutoff values. The curves generated for each model were compared using methods described by DeLong et al.24
In the second phase we validated the findings from the exploratory study in a different population. We compared ROC curves and used a two-sample z-test for comparing proportions.
Detailed methodology and definitions of simulator parameters are provided in the online supplement.
Results
Subject population
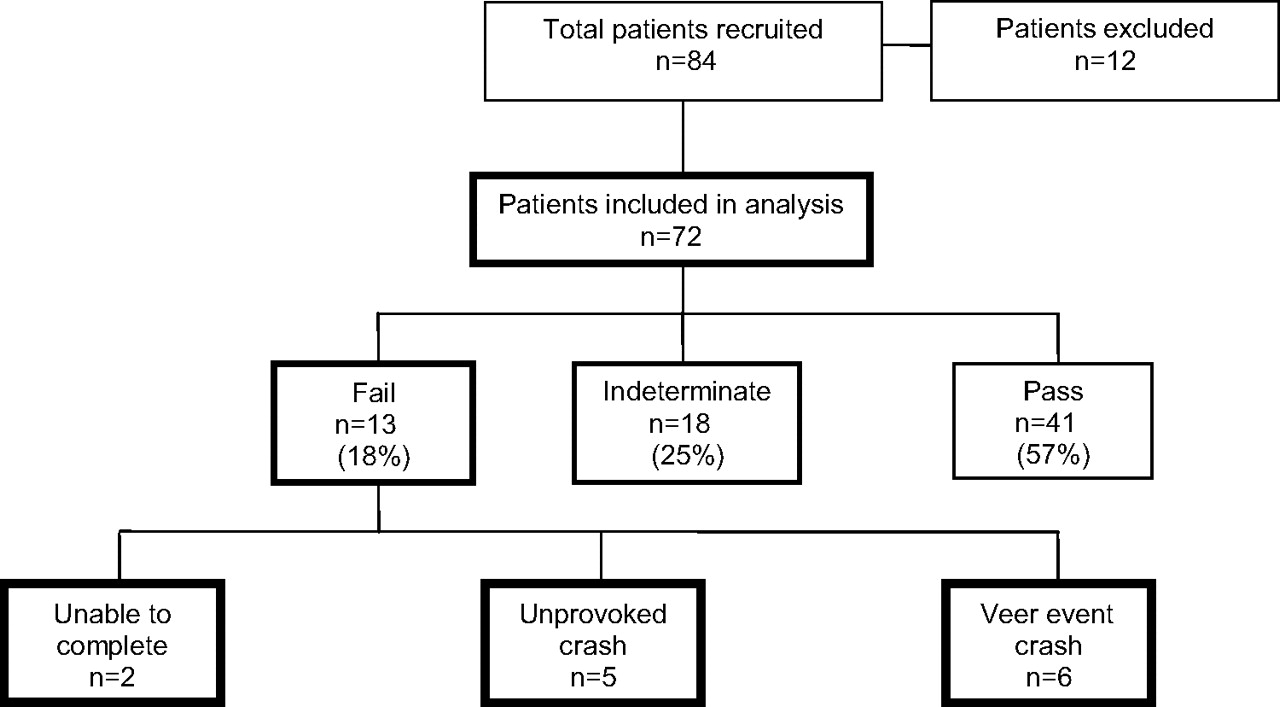
Two hundred and twenty-nine patients participated in the study. Eighty-four patients were recruited for the first phase and 145 for the second. Twelve patients were excluded from each of the two phases due to inability to complete the two runs (practice and test), time constraints, simulator sickness (n=4) and inability to sit continuously for 50 min. The characteristics of the 205 patients who completed the studies are described in table 1. There were no differences between the two cohorts except that the apnoea hypopnoea index in patients in the first phase was significantly higher (p=0.009).
Characteristics of the patient populations
Exploratory study
Forty-one (57%) subjects completed the simulator runs successfully. Thirty-one (43%) had some form of task failure (figure 1). Of the 13 subjects who failed, 9 also crashed at the brake event. Two subjects could not complete the full test run as they veered out of lane into the central reservation. One of them fell asleep.

Driving simulator outcomes of all patients in the exploratory phase of the study.
Simulator variables
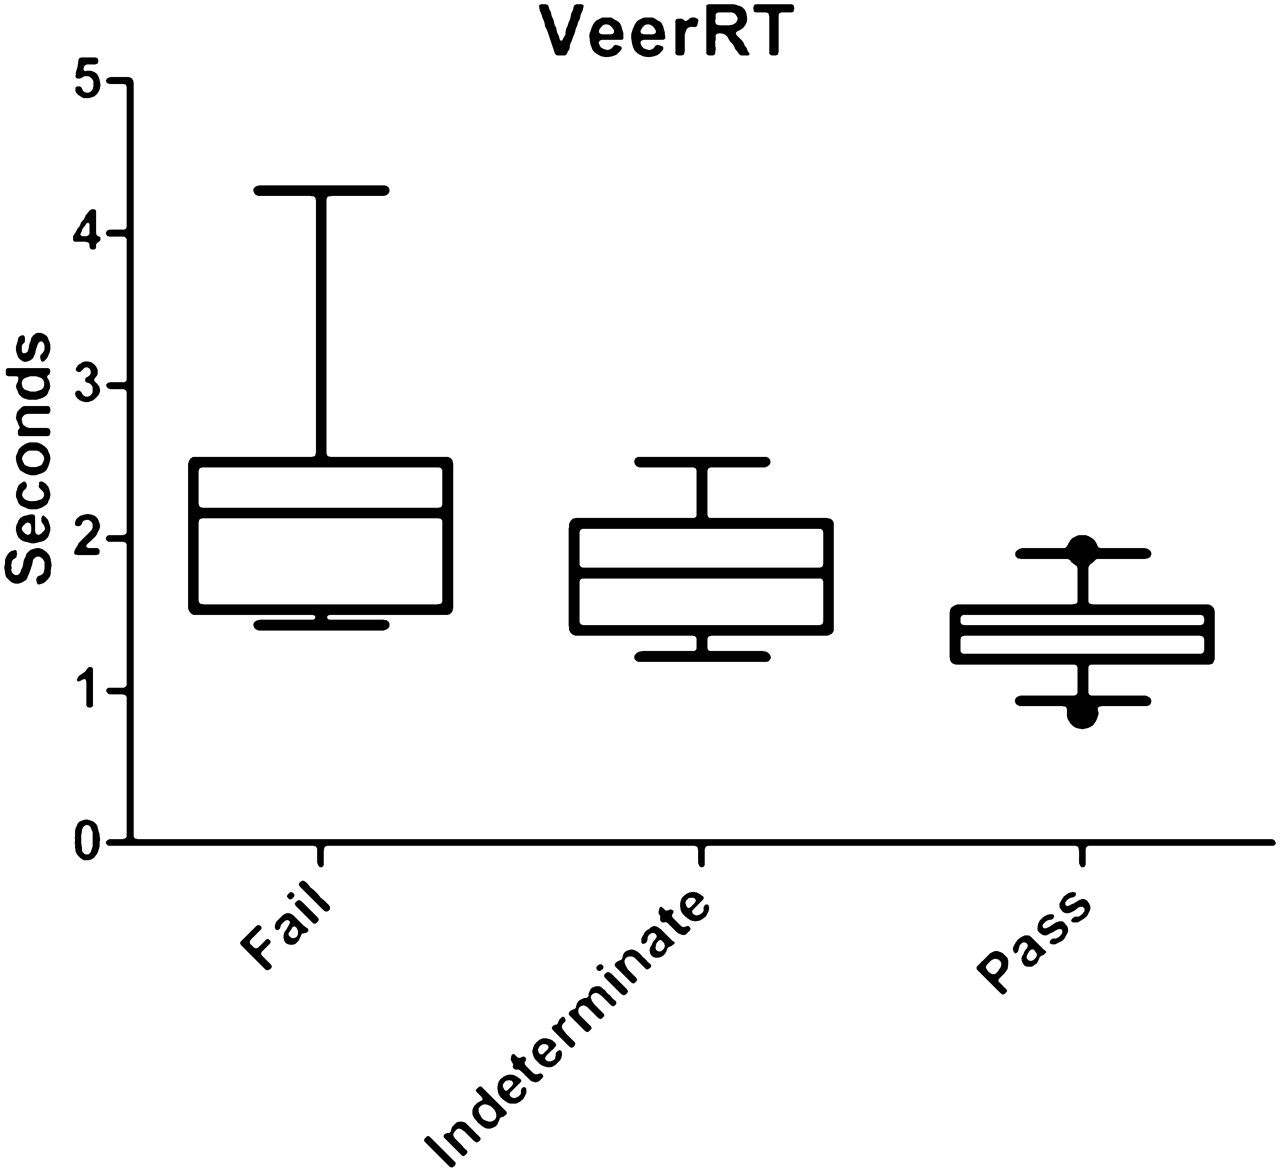
Comparisons between the three groups ‘fail’, ‘indeterminate’ and ‘pass’ are shown in table 2. There were significant differences in the ability to maintain lane position (figure 2), minimum time to collision with the vehicle in front (TTC), minimum time headway (Hw), HFS (figure 3) and RT at the veer and brake events (figure 4). These significant differences were maintained irrespective of the epochs (3, 5, 6 or 7) used and therefore, for simplicity, ease of presentation and because this may allow the test to be shortened in future, only data from epoch 3 are presented and used in the regression analyses. There was a clear distinction between ‘fails’ and the rest, but only the VeerRT and Hw 3 were significantly different between the ‘pass’ and ‘indeterminate’ groups.
Comparisons between the three groups in exploratory phase: fail, indeterminate and pass

Distribution of mean of SD of lane position (SDLP) in epoch 3 between the three groups.

Distribution of mean of proportion of high-frequency steering activity (HFS) in epoch 3 between the three groups.

Distribution of mean veer reaction time (VeerRT) between the three groups.
Regression analysis and ROC curves
Two predictive models emerged in differentiating ‘fails’ from the others. Model 1—including only the SDLP 3, and Model 2—includes a combination of SDLP 3 and VeerRT.
Model 2 had higher predictive power. Figure 5 compares the two models using ROC curve analysis and reinforces the finding from the regression analysis. The first model has an area under the curve (AuC) of 0.89 and the second 0.93. The difference between the two ROC curves was not significant (p=0.132). Table 3 compares the sensitivities and specificities of the two models at the chosen cutoffs. The chosen cutoffs (0.15 for model 1 and 0.3 for model 2) quoted here are a compromise between extremes of high sensitivity and high specificity, giving equal weight to both. The details of the extremes of cutoffs, regression coefficients and equations are provided in the online supplement.

Receiver operating characteristic curves for the two models.
Comparing optimum sensitivities and specificities of the two models
A similar regression analysis was performed excluding those who had ‘failed’ to distinguish between ‘indeterminates’ and ‘passes’. AuC in the ROC curve analysis was 0.84.The sensitivity of that model to identify ‘pass’ was 97% (95% CI 86% to 99%) with 53% (95% CI 26% to 79%) specificity; VeerRT and Hw were the parameters in the equation. The positive predictive value was 84% (95% CI 70% to 93%) and the negative predictive value only 88% (95% CI 51% to 99%) using a cutoff of 0.5. Hence using simulator data the ‘failed’ group could be predicted with much greater certainty than the ‘indeterminate’ group.
Validation study
One hundred and thirty-three patients were analysed for the validation study and the outcomes are described in figure 6. Most subjects who failed fulfilled more than one task failure criterion. Of the 13 subjects who could not complete the full run, 4 also had an unprovoked crash and 4 crashed at the veer event. Nine of them also failed on lane criteria. Of the 19 failed subjects who completed the full run, 12 also crashed at the brake event.

Simulator outcomes of the validation phase of the study.
Table 4 compares the three categories. The results are similar to the first phase of the study, broadly showing the same relationship between the simulator parameters.
Comparisons between the three groups in validation study: fail, indeterminate and pass
We could apply the equation from model 1 to 133 subjects and model 2 to 113 subjects due to unavailability of either of the two parameters; some subjects did not brake at the veer event and avoided a crash just by swerving; others crashed before epoch 3 and hence SDLP 3 was not available. A ROC curve was constructed with the predicted probability score for model 2 generated by the equation derived in the exploratory study for each subject. The AuC was 0.9 compared with 0.93 in the exploratory study. The difference between the two curves was not significant (p=0.570). Furthermore the calculated sensitivities and specificities at the chosen cutoffs were not significantly different between the two cohorts when compared using z-tests, confirming that the findings of the exploratory study are valid in a different population (table 5).
Sensitivities, specificities and predictive values of the two models at chosen cutoffs applied to the exploratory and validation cohorts and p values for a two-sample z-test comparing the sensitivities and specificities of the chosen cutoffs in the two populations
Discussion
We have shown in two different cohorts that with the MiniSim it is possible to distinguish, with a high degree of confidence, patients with OSAS who unequivocally crash during simulated driving from those who are able to complete a 50 min drive without incident. We can also identify a group, but with less confidence, whose performance is intermediate. Not only was their response at the veer event different from the others but there was a clear hierarchical pattern for other parameters (SDLP, HFS, Hw and BrakeRT); subjects who ‘failed’ were worst, those who ‘passed’ the best, with the ‘indeterminates’ in the middle.
The sensitivities, specificities and the predictive values can be calculated for different cutoffs; the one chosen will depend upon the attitude to risk. At one extreme, all accidents should be prevented and anybody with the slightest possibility of having an accident should be identified. At the other extreme, the emphasis will be on being as sure as possible that an individual is an unsafe driver. We have quoted compromise values for cutoffs, giving equal weight to sensitivity and specificity; others might choose a different value. Examples are given in the online supplement.
We deliberately tried to recruit patients at risk of having problems driving; many completed a 50 min run on a realistic motorway without incident. This can potentially overestimate the sensitivities and specificities compared with a general OSAS cohort. However, in real life this test would probably be used on patients with OSAS who are considered to be high risk. One problem with previous simulator studies was the number of crashes or events during the study. In a study by Juniper et al19 patients with OSAS had a median of 5.2 off-road events per hour. Similarly Turkington et al14 reported an average of 24 off-road events per hour in their study using a divided attention driving simulator. Even patients with severe OSAS do not have multiple events during 20 min of on-road driving. The criteria that we used for ‘fail’ are realistic and understandable to patients. This is very important if the test is to have credibility; an individual who fails on the simulator because they go off road multiple times might argue, quite reasonably, that this is not what happens when they drive a real car and therefore that the simulation is not valid.
While it might be reasonable to include an event such as our final ‘brake’ event, as failure to avoid this is realistic evidence of sub-optimal performance, it has the disadvantage that it may limit the usefulness of the test for repeated use. Longitudinal studies have found that behaviour adapts and changes over time, in driving simulator experiments.25 Likewise, a patient expecting something may perform differently on subsequent occasions.26 Furthermore, a patient may drive poorly at other times during the test but perform adequately at the event. Variables that are recorded continuously throughout, and of which the patient is unaware, are preferable. In common with previous studies we found that poor lane control (SDLP) was predictive of a crash.18 ,19 Predictive power was increased by the inclusion of reaction time at the veer event. Again previous studies have shown that patients with OSAS who are untreated have worse reaction times than controls and patients with OSAS after CPAP therapy.18 ,19 This is likely to be an underestimate as we had to exclude some patients from the analysis; some subjects (n=5) did not brake at all at the veer event and avoided a crash by veering out of lane, a legitimate manoeuvre; others (n=4) did not brake at all and crashed. Although this assessment requires an ‘event’ it was a subtle extension of routine driving behaviour and is unlikely to be memorable.
Though we have explored hard endpoints there must be scope for the clinician to make decisions on an individual basis. Subjects who visibly struggle to stay awake, utilise various coping strategies to stay awake (eg, one subject sang and thumped the desk throughout the test), should not necessarily be deemed to have passed. Alternatively, subjects who show good lane control but happen to crash due to a momentary lapse might still be considered to have passed. This second group are the subjects who could not be identified correctly by the regression analysis. The ‘indeterminate’ group warrant further study; while it can be argued that failure at the brake event alone does not necessarily indicate unsafe driving, their performance across a wide range of measures was clearly worse than those who passed.
Many questions still need to be answered before the MiniSim, or similar advanced simulators, can be used to help advise patients with OSAS about driving, but it does hold promise. It has significant advantages over previously described simulators in terms of realism and results that are credible in terms of their relationship to normal driving. That events can be reliably predicted from parameters of which the patient is unaware is an advantage. An objective test is an advance over the current situation in which inconsistent advice is given, based upon unreliable data, coloured by the clinician's individual stance on driving and accident risk. The work described here is the first step towards the development of an objective test that could have a major impact on the reliability of the advice provided.
Acknowledgments
We are grateful to Michael Daly, Tony Horrobin and Hamish Jamson from the Institute for Transport Studies for their contribution to the development and running of the simulator. We are thankful to the contributions of research nurse Craig Armstrong, sleep physiologist Sue Watts, specialist nurses Martin Latham, Jampa Choedon, Mitchell Nix, Lisa Emmett, healthcare assistant Anne Kellett and Audrey Rowe and Susan Leigh from the Sleep Services administrative team.
References
Supplementary materials
Supplementary Data
This web only file has been produced by the BMJ Publishing Group from an electronic file supplied by the author(s) and has not been edited for content.
Files in this Data Supplement:
- Download Supplementary Data (PDF) - Manuscript file of format pdf
Footnotes
Funding The study was partly supported by an unrestricted grant from ResMed for healthcare assistant time to supervise simulator runs.
Competing interests None.
Patients consent Obtained.
Ethics approval NHS Research Ethics Committee, York.
Provenance and peer review Not commissioned; externally peer reviewed.