Article Text

Abstract
Background The incidence of TB has doubled in the last 20 years in London. A better understanding of risk groups for recent transmission is required to effectively target interventions. We investigated the molecular epidemiological characteristics of TB cases to estimate the proportion of cases due to recent transmission, and identify predictors for belonging to a cluster.
Methods The study population included all culture-positive TB cases in London residents, notified between January 2010 and December 2012, strain typed using 24-loci multiple interspersed repetitive units-variable number tandem repeats. Multivariable logistic regression analysis was performed to assess the risk factors for clustering using sociodemographic and clinical characteristics of cases and for cluster size based on the characteristics of the first two cases.
Results There were 10 147 cases of which 5728 (57%) were culture confirmed and 4790 isolates (84%) were typed. 2194 (46%) were clustered in 570 clusters, and the estimated proportion attributable to recent transmission was 34%. Clustered cases were more likely to be UK born, have pulmonary TB, a previous diagnosis, a history of substance abuse or alcohol abuse and imprisonment, be of white, Indian, black-African or Caribbean ethnicity. The time between notification of the first two cases was more likely to be <90 days in large clusters.
Conclusions Up to a third of TB cases in London may be due to recent transmission. Resources should be directed to the timely investigation of clusters involving cases with risk factors, particularly those with a short period between the first two cases, to interrupt onward transmission of TB.
- Tuberculosis
- Clinical Epidemiology
This is an Open Access article distributed in accordance with the Creative Commons Attribution Non Commercial (CC BY-NC 4.0) license, which permits others to distribute, remix, adapt, build upon this work non-commercially, and license their derivative works on different terms, provided the original work is properly cited and the use is non-commercial. See: http://creativecommons.org/licenses/by-nc/4.0/
Statistics from Altmetric.com
Key messages
What is the key question?
How much transmission of TB is occurring in London and what are the characteristics of cases that cluster and contribute to TB transmission?
What is the bottom line?
Up to a third of TB cases in London can be attributed to recent transmission, more than double that found when previous population-based studies were undertaken over 15 years ago.
Why read on?
We describe the characteristics of those in clusters attributable to recent transmission, explain the characteristics of those in large clusters compared to small clusters, providing an important update on TB transmission in London at a time when TB is being prioritised in England with the release of a national TB strategy.
Introduction
In the UK, TB incidence has been rising over the last 20 years1 ,2 mainly in urban centres, especially London, one of the largest, most densely populated and ethnically diverse cities in Europe.3 In 2012, nearly 3500 new TB cases were reported in London accounting for 39% of all UK cases,2 and representing an incidence of 41 per 100 000 inhabitants higher than the national average of 14 per 100 000.2 ,4 There was geographical variation across London with rates ranging from 117 per 100 000 in Newham local authority to 7 per 100 000 in Richmond-upon-Thames local authority.2 The majority were young adults aged 20–39 years (55%) and non-UK born (83%). Nearly 1 in 10 had at least one social risk factor, with more than a third of these reporting more than one.2
Strain typing data, when combined with epidemiological data, enables the identification of patients with TB involved in the same chain of transmission. This assists the implementation of timely and appropriate control measures5–7 such as enhanced contact tracing and active case finding.8 ,9 Strain typing can distinguish between disease resulting from reactivation of an infection acquired previously and a new transmission event as it assumes that cases sharing indistinguishable strain types are recently infected.10 The effectiveness of TB control activities in reducing or preventing infection can be evaluated by monitoring changes in recent TB transmission rates.8 ,9
Although reports on a number of outbreaks using multiple interspersed repetitive units-variable number tandem repeats (MIRU-VNTR) strain typing have been published,11–14 few population level studies have been carried out in the UK based on strain typing to date. A London-wide strain typing study in 1995–1997 showed a low rate of active transmission of 14%,15 and that the burden of disease in the city at that time was largely due to reactivation or importation of infection by recent migrants. The strain typing method used was restriction fragment length polymorphism (RFLP) typing, the gold standard at the time.15
Since 2010 universal prospective strain typing using 24-loci MIRU-VNTR has been implemented in England and Wales.8 The objectives of our study were to estimate the proportion of TB cases in London attributable to recent transmission to identify the characteristics of those in clusters, and to compare the characteristics of the first two cases in small versus large clusters in order to predict risk factors for cluster growth.
Methodology
Study population
We included all culture-confirmed Mycobacterium tuberculosis (M.tb) cases, resident in London, with a notification date between 1 January 2010 and 31 December 2012, strain typed using 24-loci MIRU-VNTR16 ,17 at the Mycobacteriology Reference Laboratories (MRLs) of Public Health England (PHE) (figure 1).
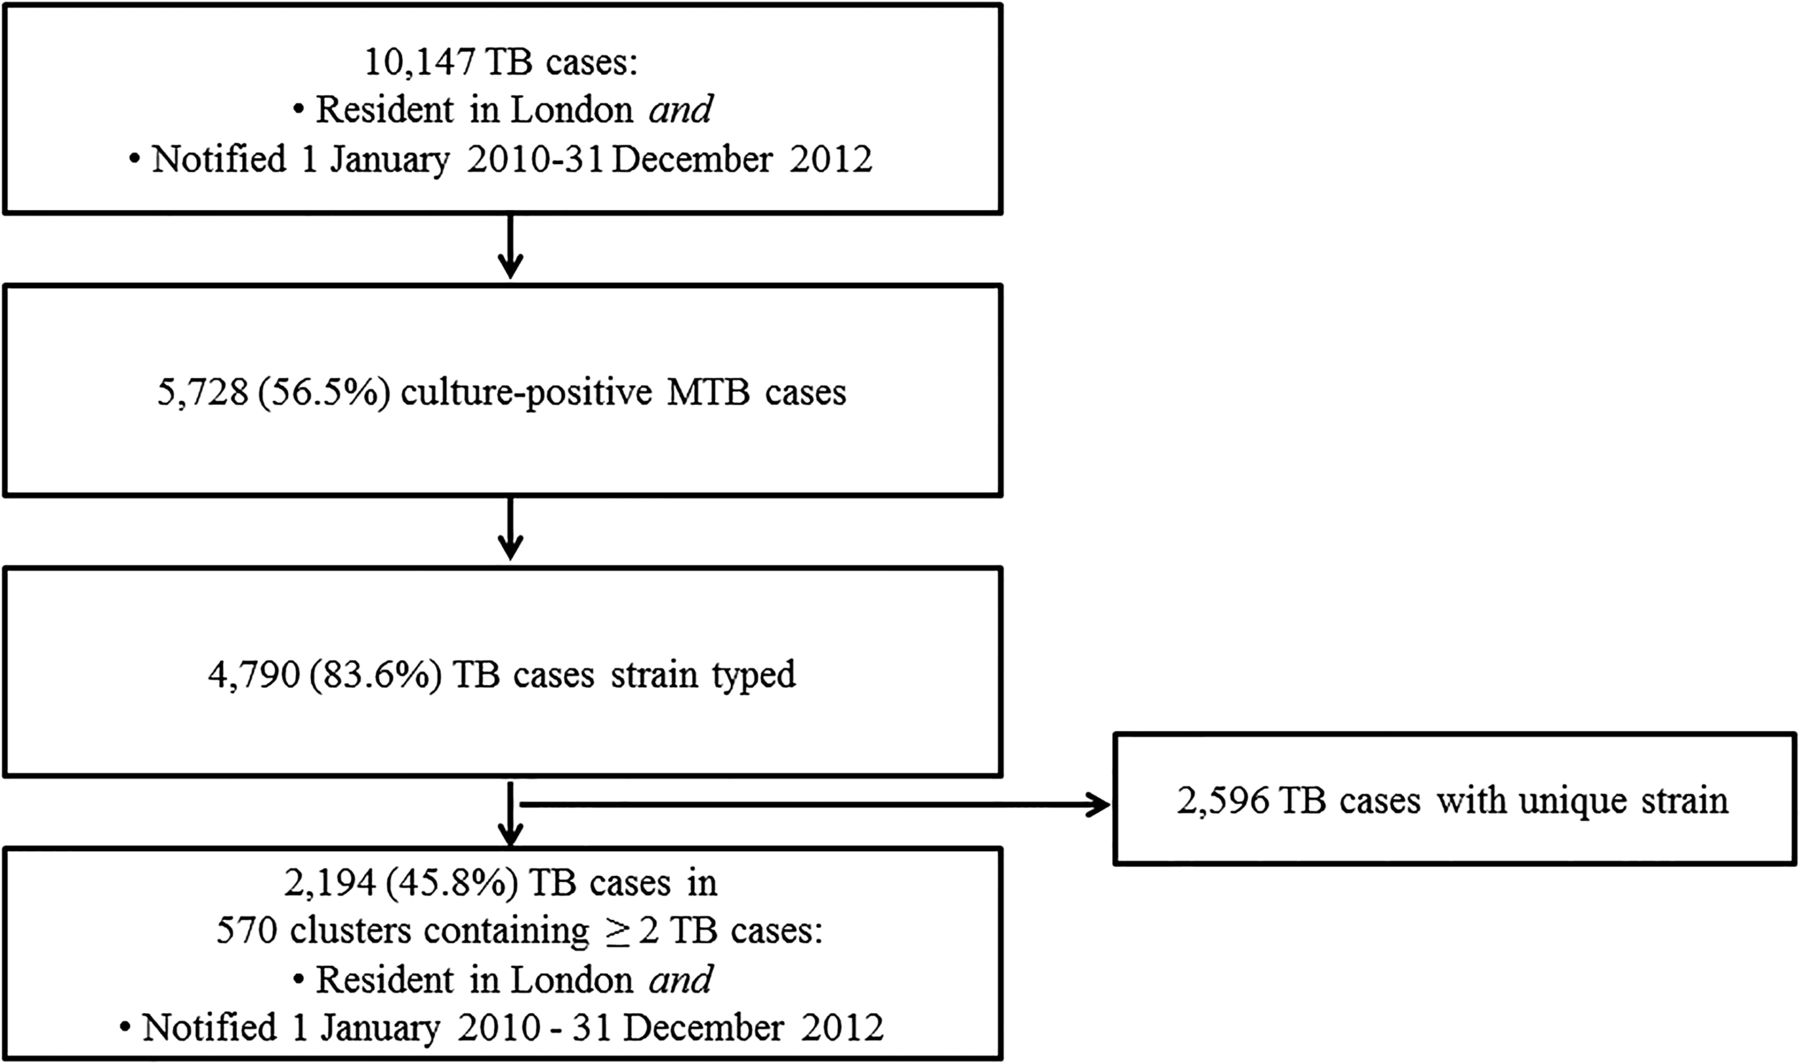
Number of reported cases of TB, including culture-positive cases, strain typed cases and clusters, London, 2010–2012.
MTB, Mycobacterium tuberculosis.
Definitions
A cluster needed to contain at least one case with a full 24-loci strain type. A clustered case was defined as any TB case from the study population with a strain with at least 23 typed loci, indistinguishable from that of at least one other case. A non-clustered case was defined as any TB case from the study population having a unique strain not shared by any other case. Clusters were defined as large if they contained five or more cases.
Geographical analysis was based upon the existing organisational jurisdictions of PHE in London (total population in 2012, 8.2 million). There are four health protection team (HPT) areas in London, each with a radius of approximately eight miles, and containing populations ranging from 1.4 to 2 million. Clusters that contained cases resident in more than one of the four HPT geographical footprints of London (South-West London, South-East London, North-West London, North-East and North-Central London), were classified as regional; those with all cases in the same HPT area were classified as local.
Notification interval (the number of days between notification date of the first and second case in a cluster) was estimated and dichotomised as short or long for each cluster according to whether it was more or less than 90 days. This was chosen based on previous work by Kik et al.18
Recent transmission of TB infection was presumed to have occurred when a case had an identical strain typing pattern to another case in the population during the 3-year period of the study.
Data collection
TB cases in London are notified by clinic staff to the PHE London TB Register, and data are then imported into the national Enhanced TB Surveillance (ETS) system. Isolate-related data were provided by the MRLs and matched to patient-related ETS data using patient identifiers as previously described.4 ,19 We collected individual data including demographics (date of birth, gender, ethnicity, country of birth and year of entry to the UK), social risk factors (current or history of, alcohol misuse, drug misuse, imprisonment or homelessness), clinical features (site of disease, sputum smear status, dates of symptom onset, diagnosis and notification, BCG vaccination status, previous TB diagnosis) and microbiology (24-loci MIRU-VNTR strain type (the first isolate from each case), drug sensitivities and lineage).19 The M.tb lineage was established as previously described.20 We derived geographical categories (regional or local) from the patient's postcode of residence and size of cluster from the number of cases.
Data analysis
We calculated proportion of recent TB transmission by the ‘n minus one’ method according to the formula (number of clustered isolates−number of clusters)/number of isolates with a strain type.21
We described features of culture confirmed cases, clustered cases and of strain typed clusters. Characteristics of cases with a strain type were compared with those without using χ2 tests for categorical variables (or Fisher exact test where necessary), and a t test for age.
We performed univariable logistic regression to identify individual risk factors for clustering using odd ratios (ORs), and multivariable logistic regression including sex and age, as potential confounders along with variables associated with clustering in univariable analysis (included if p ≤0.2). Likelihood ratio tests were used to assess possible interactions. Whether a case was born in the UK or not was excluded in the multivariable model due to colinearity with the composite variable UK/non-UK born and ethnicity.
We performed multivariable logistic regression with cluster size (large vs small) as an outcome. All explanatory variables relating to the characteristics of the first two notified cases in the cluster were included if associated with cluster size according to a univariable analysis (p ≤0.2) or potential confounders. An age group category of ≤30 years was chosen, as the highest rate and number of cases of TB in London is found in those aged 20–29 years. The variable indicating whether a case had any social risk factors was excluded from the model due to colinearity with the history of or currently being in prison variable which was included. Potential interactions were assessed using likelihood ratio tests.
Results
Isolates and strain typed clusters
Between 1 January 2010 and 31 December 2012, 10 147 TB cases were notified in London residents (figure 1). Of those, 5728 (57%) were culture-confirmed as M.tb. Individuals with M.tb culture confirmation were younger than those without (37 vs 38 years old on average, p<0.01), more likely to be male (59% vs 41%, p<0.01), born outside the UK (57% vs 43%, p<0.01), have pulmonary disease (68% vs 32%, p<0.01), less likely to have extrapulmonary disease (46% vs 54%, p<0.01) and have at least one social risk factor (67% vs 33%, p<0.01). Of the 5728 culture-confirmed M.tb cases, 4790 isolates were typed with at least 23 loci (84%), and 2194 (46% (95% CI 44.4% to 47.2%)) were clustered in 570 clusters. The proportion of cases attributable to recent transmission in London was estimated at 34% (95% CI 32.6% to 35.3%).
The average cluster size was four individuals (range 2–55). Over half of clusters, 319 (56%) contained two individuals and just 35 (6%) had 10 or more individuals. There were 215 local (38%) and 355 (62%) regional clusters (figure 2). Of the 570 clusters, 351 (62%) comprised only non-UK born individuals and 36 (6%) only UK born. A quarter of the clusters (n=139) had at least one individual with one or more social risk factors and in nine clusters (2%) all individuals had one or more social risk factor. The most common phylogenetic lineage was the Euro-American, reported for 230 (40%) of the clusters, 170 (30%) were of Central-Asian lineage, 73 (13%) of East-African-Indian lineage and 33 (6%) of Beijing lineage.

Number of clusters according to cluster size and geography (dark grey represents local cluster and light grey represents regional cluster), London, 2010–12 (N=570).
Characteristics of clustered cases
The proportion of clustered cases decreased with age from 79% in individuals below 10 years to 37% in those >70 years old (p<0.01). The proportion of clustering varied across ethnic groups according to the following distribution (p<0.01); 76% of black-Caribbean cases; 56% of black-African; 54% of white; 43% of Pakistani; 39% of Indian and 8% of Bangladeshi cases. Clustered cases were more likely to have been born in the UK than those not in clusters (67% vs 33%, p<0.01). If not born in the UK, clustered cases were more likely to be resident in the UK for a long time: 39% of recent migrants (entry to UK ≤4 years before notification) were clustered compared with 45% of those who entered the UK five or more years ago (p<0.01) (table 1). The proportion of clustering did not vary with resistance pattern, whether any resistance (48% vs 46%, p=0.30), isoniazid mono-resistant (49% vs 46%, p=0.25) or multidrug resistance (53% vs 46%, p=0.19).
Factors associated with TB clustering; a univariable logistic regression analysis, universal MIRU-VNTR, London 2010–2012
Factors associated with clustering
In the univariable analysis clustered cases were consistently more likely to have at least one social risk factor (57% vs 45%, p<0.001): 68% and 58% of those with a history of drug and alcohol misuse were clustered respectively, 54% of cases with a history of homelessness, and 68% of TB cases with a history of imprisonment were clustered (table 1).
In a stratified analysis currently having problem alcohol use modified the association between clustering and prison history (likelihood ratio test p=0.02). Clustered individuals who abused alcohol were 6.3 (2.2–18.0) times more likely to also have spent time in prison, while those without problem alcohol use were only 1.9 (1.3–2.8) times more likely to have spent time in prison (Mantel–Haenszel test of homogeneity χ2 4.8, p value=0.03), therefore, an interaction term was added into the model. No other interactions were identified.
The final multivariable model adjusted for age, gender and all significant variables (p<0.05), demonstrated clustered cases were more likely to be male (aOR=1.2 (1.0–1.3)), born in the UK and from a black-Caribbean, black-African, white or Indian background (aOR=6.7 (3.7–12.2), 4.4 (2.6–7.6), 2.3 (1.7–3.2) and 1.9 (1.1–3.3), respectively) or born abroad and from a black-Caribbean (aOR=3.3 (1.8–5.8) or black-African (aOR=1.8 (1.5–2.2)) ethnic background, to have been previously diagnosed with TB (aOR=2.1 (1.5–3.0)), to have smear positive (aOR=1.5 (1.3–1.8)) or negative (aOR=1.4 (1.2–1.7)) pulmonary TB compared with extrapulmonary disease, to have a history of drug misuse (aOR=1.6 (1.0–2.4)), and to have a history of imprisonment and problem alcohol use (aOR=3.3 (1.2–9.3)) and were less likely to be born abroad and from a Bangladeshi ethnic background (aOR=0.5 (0.3–0.7)) (table 2).
Factors associated with TB clustering; a multivariable logistic regression analysis, universal MIRU-VNTR, London 2010–2012
Factors associated with small and large clusters
The analysis was carried out on 570 clusters in which the first case was notified between 1 January 2010 and 31 December 2012, 101 of which were classified as large (18%) and 469 (82%) as small (table 3).
In the final multivariable model adjusted for age and gender, large clusters compared with small clusters were more likely to have <90 days (a short notification interval) between notification of the first two cases (aOR=2.9 (1.8–4.6)), cluster regionally rather than locally (aOR=10.3 (4.6–22.9)) and one of the first two notified cases to have a history of imprisonment (aOR=2.8 (1.1–7.3)) (table 3).
Cluster size and association with demographics, social risk factors and clinical characteristics of the first two cases in a TB cluster; a univariable and multivariable logistic regression model, universal MIRU-VNTR, London 2010–2012 (N=570)
Discussion
We estimated that a third of TB cases in London between 2010 and 2012 were due to recent transmission when applying the n−1 approach which denies the possibility of more than one index case. Our estimates of clustering (46%) and of recent transmission (34%) remain within observed ranges for low TB burden countries; estimates from England over the same time period show 52% clustering and 40% due to recent transmission;4 a national study carried out in the Netherlands during 1993–1997 found estimates for clustering and recent transmission of 46% and 35%, respectively22; a study of seven sentinel surveillance sites in the USA during 1996–2000 estimated clustering at 48%;23 and a cross-sectional study during 2005–2009 estimated recent transmission as 23%,9 although alternative laboratory techniques and a longer period of study were used in both the latter studies.
In London, previous estimates of recent transmission in 1995–1997 and in 1998 were lower at 14% and 7%, respectively,15 ,24 indicating an increase in recent transmission over the last 15 years. The studies, however, are not directly comparable since an alternative laboratory technique was used, RFLP.
Individuals with both smear positive and smear negative pulmonary disease were more likely to cluster than those with extrapulmonary disease. Although it should be noted that those with extrapulmonary disease are less likely to be cultured. Patients with smear negative disease are less infectious but do transmit disease.25 ,26 This could be a limitation of the laboratory methodology, or perhaps a reflection that there are more opportunities for infecting others due to the presumption that those with smear negative disease are less infectious, and therefore, less precautions are taken in limiting onward transmission from these patients.25 Patients with smear positive or negative disease do appear to be contributing to recent transmission of TB and should, therefore, be followed up appropriately during public health investigations.
Clustered cases were more likely to misuse drugs and currently be in or have a history of imprisonment along with problem alcohol use at diagnosis. In addition, one of the first two notified cases in large clusters was more likely to have a history of imprisonment than in small clusters. Cases who misuse drugs or alcohol may be less likely to promptly seek healthcare, and therefore, may have longer periods of infectiousness. Furthermore, they may be either reluctant to declare contacts or not be aware of the full names of contacts. It seems likely that contact tracing in these groups may not be as effective, leading to ongoing transmission.27
A possible explanation for the shorter interval between first cases in larger clusters may be a delay in diagnosis of the initial case resulting in a longer infectious period with greater potential to infect others or a breakdown in contact tracing for those early cases resulting in failure to offer prophylaxis to infected contacts. It could be that those in such clusters share a common exposure in the past or recently (in the UK or abroad) and manifest illness at a similar time. We have not examined individual epidemiological links between patients or yield of contact tracing for cases to explore if these are valid explanations but this will be the subject of further work.
Place and time of transmission is often difficult to identify, while we assume cases resident in London and sharing the same strain were recently infected in London, this may not be so. Recent migrants sharing the same strain may have acquired the common strain of TB circulating in their country of origin.28
Our study has some limitations. There was a high proportion (43%) of TB cases without a culture, and therefore, not strain typed. Cases without culture confirmation can contribute to transmission chains,10 and therefore, we may have underestimated clustering. Isolates from cases reported at the beginning or at the end of the study period may have been misclassified as unique strains if they were in clusters occurring either before or at the end of the study period. This would also lead to underestimation of clustering. Conversely, strains with one missing loci appearing indistinguishable from another were included even though they may not be genetically related. This could have led to an increase in the estimate of clustering.
Some clusters may have been misclassified as smaller than they actually were should we have taken a wider geographical area than London into consideration. Furthermore, clusters classed as small near the end of the study period may actually be large given time to grow.18 In addition, only characteristics of the first two notified cases were analysed, which do not necessarily represent the first cases in a chain of transmission, or cases with the earliest acquisition of infection. However, information about those cases may help promptly identify clusters more likely to grow. Although we studied cluster growth within a 3-year time period it is possible that studying the same population over a longer time period may yield somewhat different results. But we would not anticipate a major change in the findings or the direction of the results. We also recommend that this analysis is repeated using five years of data.
Our study provides important updated information about current TB transmission in London using new strain typing techniques more than 10 years after previous studies were published. One-third of cases were found to be due to recent transmission and we have identified population groups in whom that is more common. This provides useful information for TB services and policy makers to help identify where resources may be best deployed.
We would recommend that TB services target contact tracing efforts to those with social risk factors such as substance abuse and prison history,29 ,30 and ensure all their contacts are identified, seen and screened to promote early case detection and prevent further transmission. Enhanced interventions are also needed such as the continuation of ‘Find and Treat’ as a service to actively case find among populations with social risk factors31 and to ensure through outreach, that such patients complete treatment.32 We recommend contact tracing should be thorough and prioritised in clusters where the time lag between the first two notified cases is less than 3 months. The advent of whole genome sequencing for TB is likely, when combined with the epidemiological surveillance data, to enable further discrimination of the epidemiological links between individuals in clusters and will, therefore, help us better direct the resources required for improved TB control. Strategically, there have been changes that support the TB control effort; TB is being prioritised in the UK with the development of a national TB strategy33 and within London the formation of a London TB Control Board. Our work contributes to the understanding of TB transmission in London and provides evidence for determining appropriate local TB control strategies.
Acknowledgments
We would like to thank the PHE TB Strain Typing Project Board (Professor John Watson, Dr Stephen Morton, Dr Philip Monk, Professor Francis Drobniewski, Professor John Magee, Dr Grace Smith, Dr Lucy Thomas), and the London TB register (LTBR) team (Lamya Kanfoudi, Neelam Alhaddad, Sanch Kanagarajah, Suad Jama and Jacqueline Carless) for their support to the study. We also thank clinicians and nurses across London who provided data to the LTBR without which this study would not be possible.
References
Footnotes
ELH and ALM contributed equally.
HM and SRA both supervised production of this work.
Contributors HM had the original idea and initiated the project. The project was overseen and led by SRA during September 2010 to September 2013 and thereafter by HM. ALM designed data collection tools and extracted data. ELH subsequently extracted further data and performed additional analyses. ALM wrote the initial statistical analysis plan, cleaned and analysed the original data and drafted the first version of the paper. ELH drafted subsequent versions after developing the statistical analysis plan and cleaning and analysing further data for 2012. All authors contributed to interpretation of findings, drafting of the paper, approval for publication and are accountable for the quality and integrity of the work. HM and SRA are guarantors and have provided final approval for submission.
Competing interests None declared.
Provenance and peer review Not commissioned; externally peer reviewed.
Linked Articles
- Editorial
- Tuberculosis
- Tuberculosis
- Airwaves