


Abstract
Background Immune checkpoint inhibitors have emerged as a standard of care treatment for non-small cell lung cancer (NSCLC). To get insight into variations in tumour growth kinetics and their potential predictive values for outcome, we evaluated tumour growth rate (TGR) in patients receiving programmed cell death 1 (PD-1) checkpoint inhibitors.
Patients and methods Differences in TGR before and after the start of treatment were calculated by entering the sum of the longest diameters from computer tomography scans before and after the initiation of therapy into a formula that assumes volumetric exponential tumour growth. TGR variations, possible predictors for TGR changes and its relationship to overall survival (OS) were studied. For comparison, tumour response was assessed using Response Evaluation Criteria in Solid Tumours (RECIST) version 1.1.
Results Among the 58 evaluable patients, 37 patients (64%) showed deceleration of TGR and 16 patients (27%) showed an acceleration of TGR after initiation of therapy, with a significant difference in median OS of 18.0 months versus 6.0 months (hazard ratio 0.35, 95% CI 0.18–0.71) between these groups. Four patients (7%) were defined as having hyperprogressive disease. In five patients (9%), tumour growth remained stable. These TGR categories were not significantly different according to age, sex, histology, smoking or previous radiotherapy. Of the patients defined as having progressive disease by RECIST version 1.1 at first follow-up, 40% showed response to checkpoint inhibitors by a decrease in TGR.
Conclusion Tumour growth kinetics can be used as a clinically relevant predictor for OS in anti-PD-1-treated patients with NSCLC, and may provide additional information to RECIST measurements.
Abstract
Tumour growth rate changes can be used as a clinically relevant predictor of overall survival during PD-1 inhibitor therapy for NSCLC and provide additional information to RECIST measurements alone http://bit.ly/2nxT17e
Introduction
In recent years, immune checkpoint inhibitors (CPIs) for programmed cell death 1 (PD-1) have emerged as a standard of care treatment option with an increase in survival and this has changed the way patients with cancer are managed [1]. CPI treatment is associated with novel patterns of tumour response, and evidence suggests that treatment with these immunotherapeutic agents may even backfire in certain patients [2].
In current practice, the antitumour activity of therapeutic agents is assessed using the Response Evaluation Criteria in Solid Tumours (RECIST) guidelines, originally published in 2000 and revised in 2009 as version 1.1 [3]. This utilises unidimensional diameter measurements for the evaluation of response. Progression is defined as an increase in tumour size (which is the summation of the longest diameter of five target lesions) of more than 20% compared to the lowest determined tumour size at any point in time. The possibility of pseudo-progression [4–6] necessitated a second update of RECIST and in 2017, iRECIST was adopted as a novel tumour response evaluation tool in patients with immunotherapy treatment [7]. Several authors have suggested that RECIST criteria may be inadequate to capture the response to immunotherapies [8–13].
At first, anecdotal evidence of rapid disease progression in patients treated with immunotherapy was reported [14, 15]. This was followed by a review of the tumour growth rate (TGR) in 131 patients with different tumour histology upon treatment with anti-PD-1 therapies, which revealed that 9% of patients developed accelerated tumour growth that was subsequently characterised as hyperprogressive disease (HPD) [16]. To identify tumours showing HPD, tumour growth kinetics were integrated into the response evaluation method and implemented in multiple recent studies [16–20] (table 1). In all five studies, the definitions of HPD, tumour kinetics and time are taken into account, which are not part of the RECIST measurements. For example, TGR uses the same computed tomography (CT) measurements as RECIST but assumes that volumetric tumour growth follows an exponential law. Also, it integrates the time intervals between CT scans, allowing a quantitative assessment of the dynamics and kinetics of the tumour. In both RECIST and TGR, each patient is used as his or her own control. TGR has already been successfully used to evaluate the activity of multiple agents other than CPIs and in other tumour types [16, 21–24] and for this study the authors believe that it can be instrumental to identify therapeutic effects in the treatment with immunotherapeutic agents other than for HPD.
Definitions of hyperprogressive disease in immunotherapy using tumour growth kinetics
In this study, it is hypothesised that tumour growth kinetics based on CT measurements provide clinically relevant information in CPI treatment for NSCLC and is associated with clinical outcome. RECIST measurements and TGR differences before and after initiation of CPI treatment were analysed in NSCLC to assess the variations in tumour growth kinetics and their potential predictive values for outcome.
Material and methods
Patient selection
Between June 2015 and September 2017, 196 patients with NSCLC were treated with the anti-PD1 immune CPI nivolumab as a second-line therapy in an early access program (EAP) and as standard of care at the Erasmus MC, Erasmus University Medical Center (Rotterdam, The Netherlands). The Erasmus MC is a tertiary hospital to which patients were referred from other hospitals for CPI treatment. Nivolumab was administered intravenously at a dose of 3 mg·kg−1 every 2 weeks.
Out of these 196 patients, 58 were eligible for inclusion (figure 1a). These patients had: 1) a baseline CT scan prior to the initiation of therapy (<2 weeks); 2) at least one pre-baseline CT scan taken before the baseline CT scan, during which interval no treatment was provided; and 3) at least one follow-up CT scan following immunotherapy available for adequate review. For the pre-baseline CT scan, the last CT scan from the referring hospitals was frequently used. As patients were referred for CPI treatment from other hospitals and given the EAP application procedure, there was a time lag between the determination of progression on the last systemic treatment and the start of the new therapy. The median time between the pre-baseline and baseline CT scan was 1.8 months, ranging 1.3–6.8 months. A small window between the baseline CT and the start of therapy of no more than 2 weeks was required. Follow-up scans were performed according to the treating physicians' discretion as a part of clinical care without predefined intervals. There was an expected average time of 6–8 weeks between the baseline CT scan and response assessment.

a) Patient selection flow chart. b) Reviewed computed tomography (CT) scan moments. PREBA (pre-baseline to baseline): time between pre-baseline and baseline CT scan; BAFFU (baseline to first follow-up): time between baseline and first follow-up CT; red marked area: time between baseline CT and start of nivolumab, which was <2 weeks. RECIST: Response Evaluation Criteria in Solid Tumours.
No data on the presence of molecular alterations or on the proportion of patients tested for these aberrations were collected in this population. However, because in the Netherlands the majority of patients are tested at least for epidermal growth factor receptor and alkaline phosphatase at the time the patients in this study were diagnosed and treated and no patients were pre-treated with molecular alteration-directed therapy, we do not expect a high proportion of patients having such an alteration.
Assessment of tumour growth kinetics
The pre-baseline, baseline and first follow-up CT scans were retrospectively reviewed for the assessment of tumour burden and identification of target lesions (figure 1b). Identification of target lesions and tumour size measurements were quantitatively assessed by the radiologists using RECIST v.1.1 [10]. In brief, target lesions (≥10 mm in the longest diameter for non-nodal lesions and ≥15 mm in short axis for nodal lesions) were selected on baseline scans with a slice thickness no greater than 5 mm, allowing up to two lesions per organ and up to five lesions in total [10]. Only patients with at least one target lesion on baseline scan were included. Follow-up scans were performed according to the treating providers' discretion as a part of clinical care without predefined intervals.
Definitions
Tumour size was defined as the sum of the longest diameters (SLD) of the target lesions for pre-baseline, baseline and the first follow-up scan as per RECIST v.1.1. According to RECIST v.1.1, the tumour response was classified as: complete response (CR), partial response (PR), stable disease (SD), and progressive disease (PD) [5]. To report the tumour size difference between PREBA (pre-baseline to baseline) and BAFFU (baseline to first follow-up) in a clinically meaningful way, time was taken into account as a factor. This was expressed as the percentage difference in SLD of the target lesions for the reference period of 6 weeks, which is the planned time between follow-up CT scans (SLDdiff):

 TGR was calculated across the same clinically relevant treatment periods (and if relevant between follow-up scans thereafter). Tumour size was expressed in the same way, using SLD. If t is the time expressed in months for the period between CT scans, the tumour volume at time t is equal to:
 assuming that tumour growth follows an exponential law. V0 is the tumour volume (V) at baseline and TG is a measure of tumour growth. We approximated V by:
 where R, the radius of the sphere, is [25]:
 TG is then:
 To report the TGR results in a clinically meaningful way, we expressed TGR as a percentage increase in V during 1 month using the following transformation:
 TG and TGR were calculated using the following transformation:


 For patients who had disease progression with new lesions, the SLDdiff and TGR were computed on the target lesions only (new lesions were not included in the SLD). HPD was defined as a twofold or greater increase in TGR from baseline. True-HPD was defined as a twofold or greater increase in TGR from baseline and PD was defined by RECIST v.1.1 at the first follow-up evaluation, according to the definition of Champiat et al. [16].
Statistical analysis
Overall survival (OS) was determined as the time between the first administration of nivolumab and the time of death by any cause; patients lost to follow-up were censored. OS was estimated and presented graphically using the Kaplan–Meier method. Survival curves were compared using the log-rank test. Hazard ratios (HRs) were estimated from Cox proportional hazard models. Statistical comparisons were performed using the Chi-squared or Fisher's exact test for categorical data and a t-test was used for continuous variables. All the tests were two sided and significance was assumed if p<0.05. All the analyses were done using IBM SPSS statistics version 23. The study protocol was reviewed and the demand for informed consent was waived as the study was based on existing clinical data.
Results
The majority of the 58 patients included for analysis were male (59%) and the mean age was 63 years (range 35–79). Overall, 10% of patients were nonsmokers, 83% were either current or ex-smokers and for 7%, smoking status was unknown. Histological types were: adenocarcinoma (71%), squamous cell carcinoma (22%), large cell (2%), NSCLC not otherwise specified (2%), and unknown (3%). Most patients had a World Health Organization (WHO) performance score of 1 (47%) or 0 (43%), 3% had performance score of 2 and for 7% this was unknown (supplementary table 1).
All patients received prior chemotherapy for a median duration of 4.1 months between the last administration of chemotherapy and the administration of CPI, ranging from 0.7 to 24.6 months in the 53 patients with a known exact stop date. A total of 39% of 56 patients received prior radiotherapy to the chest for a median duration of 9.6 months between the last radiation dose and the first administration of CPI, ranging from −2.1 to 24.6 months. In two patients this was not recorded.
The median OS was 11.5±2.8 months. The median duration of treatment was 4 months (range 0–25 months). The mean time from the pre-baseline to baseline (TimePREBA) CT scan was 10.5±5.1 weeks. The mean time from BAFFU (TimeBAFFU) was 5.8±1.7 weeks. At the first follow-up CT scan, patients were categorised by RECIST version 1.1 into: CR n=0 (0%), PR n=7 (12%), SD n=41 (71%), and PD n=10 (17%) patients. Figure 2a shows how follow-up CTs were classically evaluated, taking the baseline CT as the zero point, and categorising tumour growth at follow-up according to RECIST. Lines ending above zero represented tumour growth, with a 20% increase in total tumour size being the cut-off for PD. Lines ending below zero represented tumour shrinkage, with −30% being the cut-off for PR.

Response Evaluation Criteria in Solid Tumours (RECIST) categories at first follow-up and hyperprogressive disease (HPD). a) Tumour growth in sum of the longest diameters (SLD) difference (diff) between baseline and first follow-up. b) SLDdiff before and after baseline. c) Tumour growth in tumour growth rate (TGR) before and after baseline. d) Overall survival (OS) when differentiated according to RECIST response categories (log-rank p=0.004). e) OS according to HPD (log-rank p=0.041). True-HPD (black): HPD defined as PD at the first evaluation with a twofold or greater increase in TGR from baseline; no HPD (yellow): patients not showing HPD at first follow-up. PREBA: pre-baseline period; BAFFU: period from baseline to first follow-up; PR: partial remission; SD: stable disease; PD: progressive disease; FU: follow-up.
Next, we compared the above change in sum of the diameters according to RECIST after the start of treatment to the change in sum of the diameters before the start of treatment (fig. 2b). Of the 10 patients showing PD at first follow-up, CPI caused a decrease in the growth rate in four patients (40%), an increase in TGR in five patients (50%) and in one patient (10%), the tumour growth did not significantly change (defined as a change ≤5%). Of the 41 patients showing SD at first follow-up, CPI caused a decrease in growth rate in 26 patients (63%), an increase in TGR in 11 patients (27%) and in four patients (10%), the tumour growth did not significantly change. In all seven patients showing PR at first follow-up, CPI caused a decrease in tumour growth.
TGR is derived from the SLD but accounts for an assumption for tumour volume. In figure 2c the TGR before and after initiation of CPI therapy is shown. and although this gives a similar representation of the changes in growth pattern it is harder to correlate with the RECIST criteria than figure 2b.
In total 11 patients (19%) fulfilled the definition of HPD based on TGR alone defined as a >50% increase in TGR between PREBA and BAFFU. Overall, four patients (7%), were defined as having true-HPD, because they showed PD according to RECIST at the first follow-up on top of the >50% increase in TGR.
OS was differentiated according to RECIST version 1.1 response categories: PR 25.3±5.3 months, SD 10.3±2.5 months and PD 6.0±2.6 months (log-rank p=0.004) (figure 2d). When differentiating according to HPD status an OS of: no true-HPD 12.3±4.3 months versus true-HPD 2.3±2.7 months was observed (log-rank p=0.041) (figure 2e)
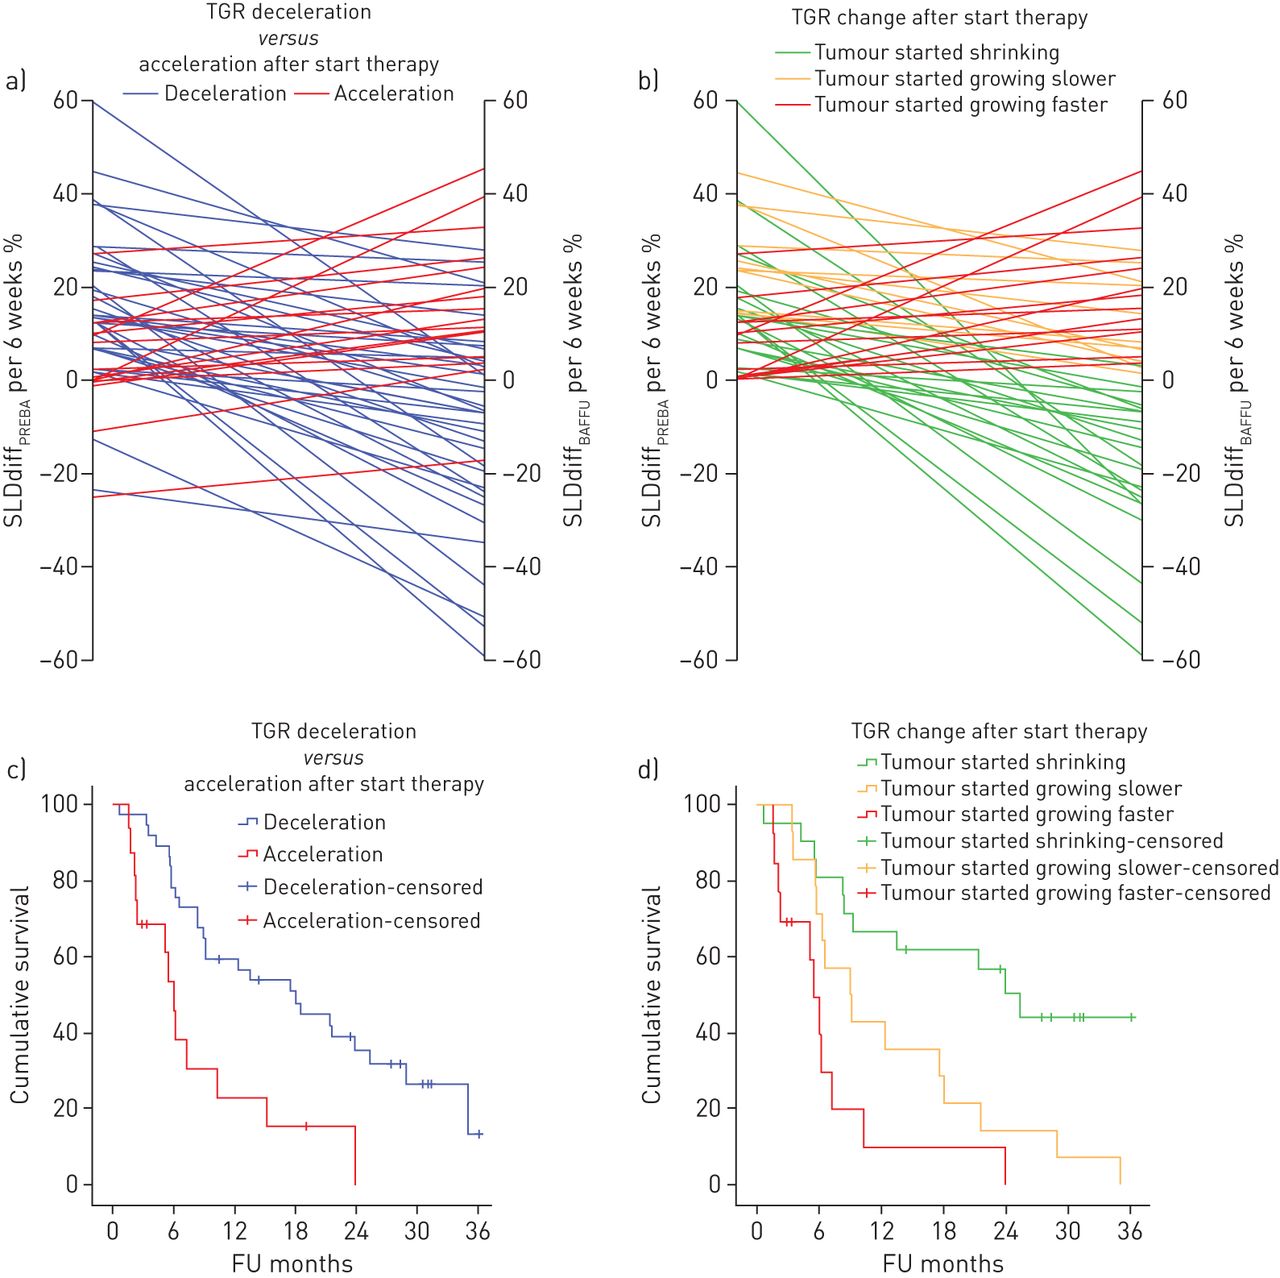
The distribution of TGR across the two periods is as follows; PREBA period: median TGR 28.0 (range: −48.6 to 293.7) and BAFFU period: median TGR 6.9 (range: −83.8 to 142.6). The group was divided into patients showing tumour growth acceleration (TGR/SLDdiff at BAFFU>PREBA) n=16 (27%) and patients showing tumour growth deceleration and/or shrinkage (TGR/SLDdiff at BAFFU<PREBA) n=37 (64%) after the initiation of therapy, excluding patients with stable TGR n=5 (9%) (<5% difference in TGR per month) (fig. 3a). Comparison of acceleration in TGR with deceleration in TGR provided a significant difference in median OS of 6.0±0.6 months versus 18.0±4.4 months, log-rank p=0.002 (fig. 3c). Deceleration of TGR reduced the risk of early death with an HR of 0.35; 95% confidence interval of 0.18 to 0.71. By only taking into account the 48 patients showing tumour growth before the start of CPI, the TGR could be further divided into a group that showed tumour shrinkage after initiation of therapy (n=21, 44%), tumours that kept growing but with a decreased growth rate (n=14, 29%) and tumours that kept growing but increased their growth rate (n=13, 27%) (figure 3b). This provided a significant difference in median OS of 25.3±3.6 months versus 8.9±2.5 versus 5.5±0.7 months; log-rank p<0.001 (figure 3d). When plotting OS against growth rate in SLDdiff at 6 weeks after baseline, the effect of these growth patterns can be appreciated (figure 4).

a) Tumour growth rate (TGR) acceleration versus deceleration after start of therapy. b) Patients showing growth before the start of therapy grouped according to change in growth pattern after start of therapy. c) Overall survival (OS) according to increase versus decreased TGR after start of therapy (log-rank p=0.002). d) OS according to change in TGR after initiation of therapy (log-rank: p<0.001). SLD: sum of the longest diameters; diff: difference; PREBA: pre-baseline period; BAFFU: period from baseline to first follow-up; FU: follow-up.

Overall survival plotted against the sum of the longest diameters (SLD) difference (diff) at 6 weeks after the start of checkpoint inhibition in the patients that showed tumour growth before the start of therapy. The patients were divided into groups according to tumour growth rate (TGR) change. Patients showing tumour growth with an increased growth rate (red) as well as with a decreased growth rate (yellow) go over the 20% growth line, defining progressive disease at first follow-up.
Overall, five patients (9%) showed tumour shrinkage before initiation of therapy during the PREBA period. In figure 2b and c and figure 3a these can be recognised as lines below zero during the PREBA period. To analyse why CPI therapy was started, the CT scan before pre-baseline was evaluated. In two patients there was an increase in TGR before the pre-baseline scan, two patients showed increase in non-target lesions and one patient had a suspected lymphangitic carcinomatosis.
No correlation between TGR or SLDdiff during PREBA and during BAFFU was found. No significant correlations were observed in sex, age, histology, WHO performance score, smoking and previous radiotherapy for patients showing tumour growth acceleration when compared to patients showing growth deceleration. For the patients showing true-HPD no significant correlations were observed in sex, age, histology, WHO performance score, smoking and previous radiotherapy when compared to the rest of the studied population. Overall, three out of the four patients with true-HPD were ≥65 years old; the fourth patient was 46 years old.
Discussion
This study explores the dynamics of tumour growth in patients treated with CPI for NSCLC. We confirm the presence and incidence of HPD, but we also describe a novel phenomenon that in those tumours that keep growing, a decrease in TGR induced by CPI is associated with improved survival. The division of the group into patients showing deceleration in TGR versus acceleration in TGR at first follow-up after the start of CPI therapy, provided a significant and clinically relevant difference in OS of 12 months. This is relevant, as the patients in each group fall into different RECIST categories. For example, patients with a decrease in TGR on CPI might still be growing fast enough to be categorised as having PD at the first response assessment. However, these patients have a significantly better OS than a patient with a tumour that responded with an increase in TGR. Of the patients showing PD according to RECIST criteria by an increase of SLD ≥20%, 40% actually had a decrease in tumour growth. In these patients, after determination of PD, in general the immune therapy will be withheld, potentially deteriorating the outcome of the patient. In this particular group, treatment beyond progression was given when a patient was in good clinical condition, given the option of pseudo-progression. This may also (partly) explain why we found an increase in OS, but further treatment may be beneficial for these patients. As far as the authors are aware, only Lahmar et al. [15] recently presented an abstract describing a similar analysis in 58 patients with NSCLC treated with CPIs and categorised their response patterns according to increasing or decreasing TGR after the initiation of therapy. In line with our findings, they also found a significant relationship between treatment TGR and OS after immunotherapy.
When the growth patterns were further divided into three groups, (i.e. a group that showed tumour shrinkage after initiation of therapy; tumours that kept growing but with a decreased TGR; and tumours that kept growing but with an increased TGR), significant differences in median OS of 25.3, 8.9 and 5.5 months, respectively, were found. When comparing just the two groups that kept growing, only a tendency towards significance was found, p=0.065, possibly due to the small number of patients. No significant differences for the patients showing TGR acceleration were observed in sex, histology, smoking and previous radiotherapy when compared to the patients showing deceleration.
Of the 58 patients found eligible for inclusion in this study, four (7%) had true-HPD, defined as showing PD according to RECIST at the first evaluation with a twofold or larger increase in TGR between the period prior to treatment (PREBA) and upon therapy (BAFFU). This is a comparable range as found by Champiat et al. [16] who used the same definition for HPD [16]. In a recent review, incidences of HPD up to 21% were described in patients with NSCLC specifically [8]. In other histologies, incidences up to 29% [17–19] were found but these used different, and often less strict, definitions. Comparable to the study by Champiat et al. [16] we only included patients that had a follow-up CT scan, and excluded patients who became too ill to be scanned or who died before the first follow-up CT scan. True-HPD was, in this study, a significant negative predictive value for OS. Patients with true-HPD had a median OS of only 2.3 months while the other patients had an OS of more than 1 year. This result is, again, in line with the observations by Champiat et al. [16] and Ferrera et al. [19].
In five patients, therapy was started while the RECIST SLD actually showed shrinkage prior to CPI treatment (PREBA). In three patients, CPI was started because there was unequivocal growth of nonmeasurable lesions. In two other patients it was not fully understood why CPI was started based on the CT results alone.
Many patients in the available patient cohort were not eligible for inclusion due to the relatively long time of more than 2 weeks between the baseline scan and the start of CPI treatment. To be able to use TGR in a more standardised way we recommend stricter follow-up protocols with the baseline CT scan and start of therapy ideally being on the same day. In the case of this study, up to 47% extra patients could have been included if this stricter follow-up protocol had been implemented. Another limitation of the current study is that it is a retrospective analysis. The selection of target lesions may not perfectly reflect the evolution of the whole tumour burden and new lesions were not accounted for. Moreover, we assumed that tumours do grow as spheres, while we know this is not always the case [26]. It remains to be determined whether response assessment using RECIST is the optimal basis to determine the TGR in immunotherapy. To differentiate early HPD from pseudo-progression is another pitfall in this treatment type, further underlining the importance of imaging at defined intervals, close monitoring and clear definitions.
To date, there is no definition of TGR for growth assessment in treatment with immunotherapeutic agents and it is still unclear which factors influence TGR. TGR integrates the time interval between CT scans allowing a quantitative assessment of the dynamics and kinetics of the tumour. But, as can be seen in figure 2b and c, TGR is more difficult to correlate with the RECIST criteria because the percentage in which TGR is expressed does not match the RECIST thresholds. To make TGR more related to the way tumour evaluation takes place using RECIST, the factor time was integrated into the SLD measurements, resulting in a SLDdiff in percentage over 6 weeks. This could possibly be a more accessible expression in everyday practice for tumour growth kinetics when used only to evaluate whether tumour growth is increasing, decreasing or whether it is shrinking. To find the predictors and to understand the biological mechanisms underlying the variable therapeutic effects, prospective studies with close monitoring and biopsies are necessary. But, by starting to visualise and monitor tumour growth kinetics before and after onset of therapy, insight into the response patterns in immunotherapy treatment can already be improved. In current clinical practice, we are already calculating the SLDdiff of the target lesion to evaluate RECIST response between two CT scans at a certain treatment point. If these results are put in a graph from the first available scan, a visual representation of the growth rate changes over time and how treatments are influencing these, will be obtained. Because TGR is calculated from the same measurements that determine RECIST, extra work for the radiologist would be avoided. Ideally, an integrated software application or a web page would be developed in which the SLD is entered, after which the tumour growth kinetics are visualised in a graph that represents the evolution over the different follow-up moments. When more widely used, and more data become available, graphs could be validated and cut-off values for treatment planning could be determined.
In summary, in this study, tumour growth dynamics provide clinically relevant information and additional information about response to using RECIST alone. In the current computer-driven medical world, calculating and visualising tumour growth kinetics before and during treatment can potentially improve treatment planning, and might help to decide early on, which patients might and might not benefit from treatment with CPI.
Supplementary material
Supplementary Material
Please note: supplementary material is not edited by the Editorial Office, and is uploaded as it has been supplied by the author.
Supplementary material 00179-2019.SUPPLEMENT
Footnotes
This article has supplementary material available from openres.ersjournals.com
Conflict of interest: D.M.H.J. ten Berge has nothing to disclose.
Conflict of interest: D.P. Hurkmans has nothing to disclose.
Conflict of interest: I. den Besten has nothing to disclose.
Conflict of interest: J.S. Kloover has nothing to disclose.
Conflict of interest: R.H.J. Mathijssen has nothing to disclose.
Conflict of interest: R.J.E.M.A. Debets has nothing to disclose.
Conflict of interest: E.F. Smit has nothing to disclose.
Conflict of interest: J.G.J.V. Aerts has nothing to disclose.
- Received July 19, 2019.
- Accepted October 3, 2019.
- Copyright ©ERS 2019
This article is open access and distributed under the terms of the Creative Commons Attribution Non-Commercial Licence 4.0.
References


