


Abstract
Chest computed tomography (CT) is the gold standard for detecting structural abnormalities in patients with primary ciliary dyskinesia (PCD) such as bronchiectasis, bronchial wall thickening and mucus plugging. There are no studies on quantitative assessment of airway and artery abnormalities in children with PCD. The objectives of the present study were to quantify airway and artery dimensions on chest CT in a cohort of children with PCD and compare these with control children to analyse the influence of covariates on airway and artery dimensions.
Chest CTs of 13 children with PCD (14 CT scans) and 12 control children were collected retrospectively. The bronchial tree was segmented semi-automatically and reconstructed in a three-dimensional view. All visible airway–artery (AA) pairs were measured perpendicular to the airway centre line, annotating per branch inner and outer airway and adjacent artery diameter and computing inner airway diameter/artery ratio (AinA ratio), outer airway diameter/artery ratio (AoutA ratio), wall thickness (WT), WT/outer airway diameter ratio (Awt ratio) and WT/artery ratio.
In the children with PCD (38.5% male, mean age 13.5 years, range 9.8–15.3) 1526 AA pairs were measured versus 1516 in controls (58.3% male, mean age 13.5 years, range 8–14.8). AinA ratio and AoutA ratio were significantly higher in children with PCD than in control children (both p<0.001). Awt ratio was significantly higher in control children than in children with PCD (p<0.001).
Our study showed that in children with PCD airways are more dilated than in controls and do not show airway wall thickening.
Abstract
Chest CT is the gold standard for detecting structural abnormalities in patients with PCD, and this study is the first on quantitative assessment of airway and artery abnormalities in children with PCD https://bit.ly/2XZYWjU
Introduction
Primary ciliary dyskinesia (PCD) is a genetic disorder characterised by absent cilia or impaired ciliary function [1, 2] leading to an impaired mucociliary clearance in upper and lower airways [3, 4]. Presenting symptoms may be neonatal respiratory distress [5], organ laterality defects [6], daily wet and productive cough [3], daily nasal congestion, chronic sinusitis, recurrent otitis media and nasal polyps [7, 8], recurrent lower respiratory tract infections, bronchiectasis [1, 3, 4] and male infertility [9, 10].
Follow-up should include pulmonary function tests and airway microbiology cultures [3, 11–13]. To identify and monitor the extent and severity of structural lung abnormalities in PCD, guidelines recommend a computed tomography (CT) scan for long-term surveillance [3, 14, 15]. The most common structural abnormalities on chest CT are bronchiectasis, airway wall thickening (WT) and mucus plugging [16]. In PCD, bronchiectasis is present in more than 50% of paediatric patients, with the middle and lower lobes most commonly involved [14, 16, 17].
Bronchiectasis is defined as irreversible widening of airways and/or a lack of tapering, usually resulting from a repeated pattern of infection and inflammation [18, 19]. In general, an airway–artery (AA) ratio larger than 1 is classified as bronchiectasis [20]. However, in children, smaller AA ratios have been suggested for bronchiectasis [20, 21]. Recently published studies demonstrated that the outer airway diameter/artery (AoutA) ratio is more reliable than the inner airway diameter/artery (AinA) ratio for the diagnosis of bronchiectasis [22, 23]. Airway WT is present when the airway wall diameter occupies more than 20% of the total outer airway diameter or takes up more than 33% of the adjacent arterial diameter [24, 25]. For the diagnosis of bronchiectasis and airway WT, airway dimensions are compared to the diameter of the accompanying artery. All these measurements are influenced by the inspiratory level, CT scan parameters and image reconstruction [21, 26]. Mucus plugging is present when mucus fills the airway lumen. Such filled airways can be dilated as well as in cystic fibrosis (CF) and it has been suggested that mucus obstruction can be a pre-stage of bronchiectasis [27].
Until now, scoring systems developed for CF have also been used for PCD, assuming that PCD and CF share the same abnormalities. However, PCD had a different pathophysiology, different genetic defects and patients with PCD are considered to have a milder clinical course and fewer abnormalities on chest CT scans [14, 17, 28, 29]. In CF, measurements of the AA have been described as an objective, sensitive and specific method to identify bronchiectasis and airway WT. To date, no studies have been published on AA dimensions in children with PCD.
Therefore, the primary aim of our study was to analyse AA dimensions and the number of visible airways on chest CT scans in a cohort of PCD patients compared to control patients.
The second aim of our study was to analyse the influence of covariates on AA dimensions, such as age at CT scans, age at diagnosis, forced expiratory volume in 1 s (FEV1) and forced expiratory flow at 75% of vital capacity (FEF75%).
Materials and methods
Study population
Children 6–18 years with a PCD diagnosis attending the department of Paediatric Pulmonology in Erasmus Medical Center, Sophia Children's Hospital in Rotterdam, the Netherlands, were included, if they had at least one chest CT scan performed between 2012 and 2016 as part of routine monitoring. PCD diagnosis was based on clinical history, high-speed video microscopy analysis (HSVA) and transmission electron microscopy (TEM) (VU University Medical Center, Amsterdam, the Netherlands). According to European Respiratory Society guidelines [30], all patients had a highly likely diagnosis of PCD (HSVA suggestive of PCD and nasal nitric oxide low); furthermore, TEM showed defects in eight patients; no genetic tests were done.
Clinical data were retrieved from patient files, and included: age, age at CT scan, age at diagnosis, situs inversus, neonatal respiratory distress, symptoms, lobectomy and airway microbiology. All PCD patients were reported as clinically stable at the time of scanning.
Results of the last sputum or bronchoalveolar lavage fluid culture obtained within 3 months before the CT scan were collected and labelled as positive if one or more bacteria were cultured.
Spirometry results (MasterLab, Jaeger, Würzburg, Germany) performed at the moment of CT scan acquisition or within 3 months before the CT scan as routine patient care were obtained. All spirometry values were analysed using a z-score or % predicted according to reference values of the Global Lung Function Initiative [31].
Control patients were children who underwent chest CT scanning for other indications than PCD (asthma, recurrent respiratory infections, oesophageal atresia) as shown in supplementary table A1 and were used as controls in an earlier study [21]. All controls had a good quality spirometer-guided chest CT scan, which was defined as normal by two independent radiologists, blinded to patient information.
This study was retrospective with coded data already available; it was approved by the Medical Ethical Committee of Erasmus MC (MEC 2020–0209).
Chest CT scans
Only patients with end-inspiratory, volumetric, spirometer- or technician-controlled chest CTs with a slice thickness of 1 mm were included in the study (details of scan parameters in supplementary table A2). All CT scans were conducted between 2012 and 2016 without anaesthesia. All identifying information was removed from the CT scans before analysis.
CT scans were acquired with SOMATOM® Definition Flash CT scanner (Siemens Healthcare, Forchheim, Germany) and a reconstruction kernel, both in PCD patients and in controls, equal to B75f or I70f.
Quantitative analysis of airways and arteries
AA dimensions were measured with image analysis platform Myrian®, version 2.1.0 (Lung XP module, Intrasense, Montpellier, France), following the standard operating procedure S002V2.0/01.17.2018 of the LungAnalysis Laboratory. Measurements were performed using a window setting of −200 HU and a width of 1500 HU, to optimise the contrast between airways and arteries [21, 22].
First, the bronchial tree was segmented automatically in three dimensions; airways not automatically segmented were added manually. Next, the bronchial tree was reconstructed in a three-dimensional view (figure 1). Measurements were done on cross-sectional AA reconstructions perpendicular to the airways centre line [21]. One measurement per branch was made using an ellipse tool surrounding the inner and outer airway and adjacent artery (figure 1).

a) Screen shot of airway tree three-dimensional reconstruction. b) Three measurements of the edge of airway and accompanying artery were used to annotate surface areas of the inner (A) and outer (B) airway and of the artery (C) in order to estimate diameters and to calculate the airway–artery ratios.
Measurements were not executed in case of movement artefacts, when the inner diameter could not be measured because of mucus plugging, when the outer diameter could not be differentiated (e.g. in atelectasis) or when the adjacent artery could not be identified (e.g. in atelectasis, consolidation or severe bronchiectasis).
For each reconstructed airway branch, short and long axis diameters and surface areas were measured of the inner and outer airway and of the adjacent artery in the middle of each branch. Next, diameters of the inner and outer airway were divided by diameter of the adjacent artery, in order to compute the following AA ratios: AinA ratio), AoutA ratio and WT, which was calculated as the difference between outer and inner diameter of the airway. Furthermore, WT was divided by outer airway diameter to compute an Awt ratio and by the diameter of the adjacent artery in order to compute an AwtA ratio [32].
Location of airway–artery measurements
For all AA pairs the anatomical location within the lung was annotated as follows:
The lung lobes: right upper lobe, right middle lobe, right lower lobe, left upper lobe, lingula and left lower lobe; in children with situs inversus, left lobes were analysed as right lobe and vice versa, in order to compare the lobes according to their anatomical characteristics.
Segmental bronchi, annotated with the nomenclature as specified by Netter [33].
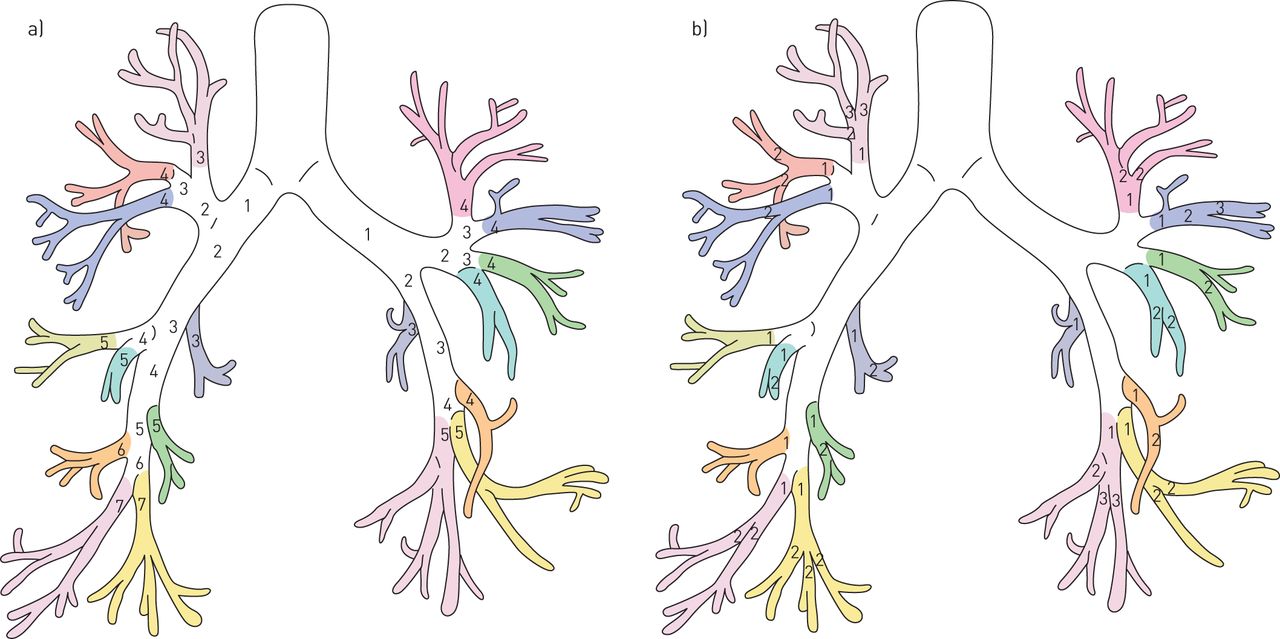
Airway generation, registered at the trachea as 0, main stem bronchi as 1, continuing adding one each time the bronchus bifurcates; this leads to number 3–4 for the upper segmental bronchi and number 4–7 to the lower segmental bronchi. This discrepancy was corrected computing the segmental generation to allow all segmental bronchi to start at segmental generation 1 (figure 2). Segmental generations ≥4 are defined as peripheral airways [21, 22].

Anatomy of the airways. a) Airway generations are defined with the numbers in different coloured segmental branches; each segmental branch starts with a different generation number (i.e. 3–4 in the upper segmental branches and 5–7 in the lower segmental branches). b) In order to correct the discrepancy between upper and lower segmental branches, we renumbered each segmental generation by labelling the first segmental bronchi as generation 1 (Artist: K. Rubenis) [21, 22].
Observer reliability
All CT scans were anonymised and randomised; the researchers, who scored the CT scans, were blinded to all clinical information. The intra-observer variability was determined as follows:
- PCD patients: the first observer (VF, 6 months of experience) measured all AA pairs during the first analysis and then, 2 months later, a total of 318 measurements were repeated in one randomly selected segmental branch of every patient.
- Control patients: the second observer (WK, 3 years of experience) measured all AA pairs during the first analysis and then, 3 months later, a total of 386 measurements were repeated in one randomly selected segmental branch of every patient [21].
For the inter-observer variability: the first observer measured 271 measurements in one randomly selected segmental branch of every control patient and these measurements were compared to the ones made by the second observer.
Statistical analysis
Descriptive statistical analysis was used for baseline characteristics of the PCD patients. The differences in AA dimensions and ratios between PCD and control patients were described as median (interquartile range) or percentage and analysed with Mann–Whitney U-test or Chi-squared test. The number of visible AA pairs, AA dimensions and AA ratios were assessed using Mann–Whitney U-test. Box plots were used to illustrate the outcomes.
To analyse the influence of covariates in AA dimensions or ratios, linear correlation was described (r2 Spearman coefficient) if the variables were continuous.
The intraclass correlation coefficient (ICC) was used to measure intra- and inter-observer agreement. ICC values between 0.4 and 0.6, 0.6 and 0.8 or ≥0.8 were considered to indicate moderate, good and very good agreement, respectively [34].
For all statistical analyses IBM SPSS Statistics 24.0 was used. No correction for multiple testing was performed and a p-value <0.05 was considered statistically significant.
Results
Study population
We identified 27 patients with a diagnosis of PCD in whom at least one CT scan was made over the considered period (i.e. 53 CT scans). We excluded 39 scans as they did not meet the inclusion criteria (figure 3). Fourteen CT scans (one patient had two CT scans), were spirometer-controlled (n=12) or technician-controlled (n=2) and with a slice thickness of 1 mm. This selection allowed us to analyse a PCD population with the same scan parameters as controls. PCD patient characteristics are shown in table 1.
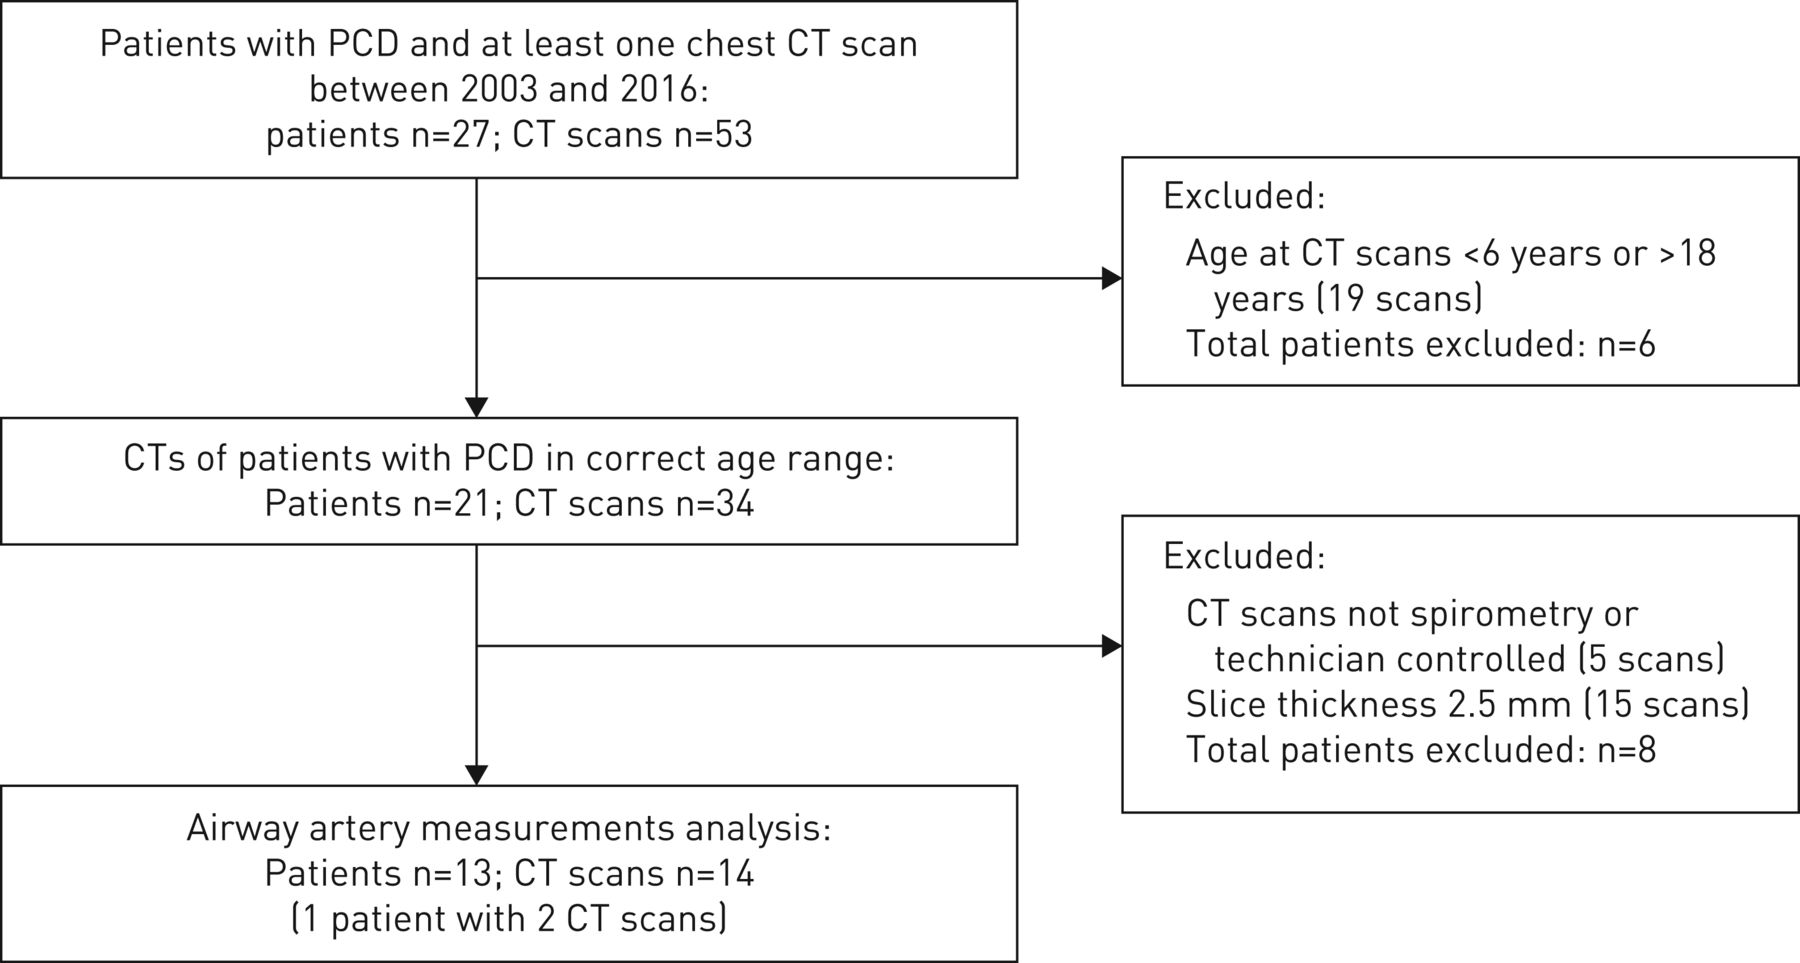
Flowchart of primary ciliary dyskinesia (PCD) patients included. CT: computed tomography.
Primary ciliary dyskinesia (PCD) patient characteristics
Twelve control patients were included; all had spirometer-controlled chest CT scans, which were defined as normal by two independent radiologists, blinded to patient information [21].
The main characteristics of PCD and control patients are shown in table 2.
Demographics of the study population
Number of airways and arteries
For the 13 PCD patients 14 CT scans were analysed and for the 12 control patients, 12 scans were analysed. The median number of airways measured for PCD patients and controls were respectively 105 (IQR 84–141) and 129 AA pairs (IQR 121–150) (p=0.129).
Similar number of AA pairs were found for PCD patients and controls in all the different segmental generations (supplementary table A3) and in all the different lung lobes (supplementary table A3).
Based on the number of AA pairs per generation we excluded generation eight for further analysis of airway dimensions between PCD patients, as only very few AA pairs were observed.
Airway–artery dimensions
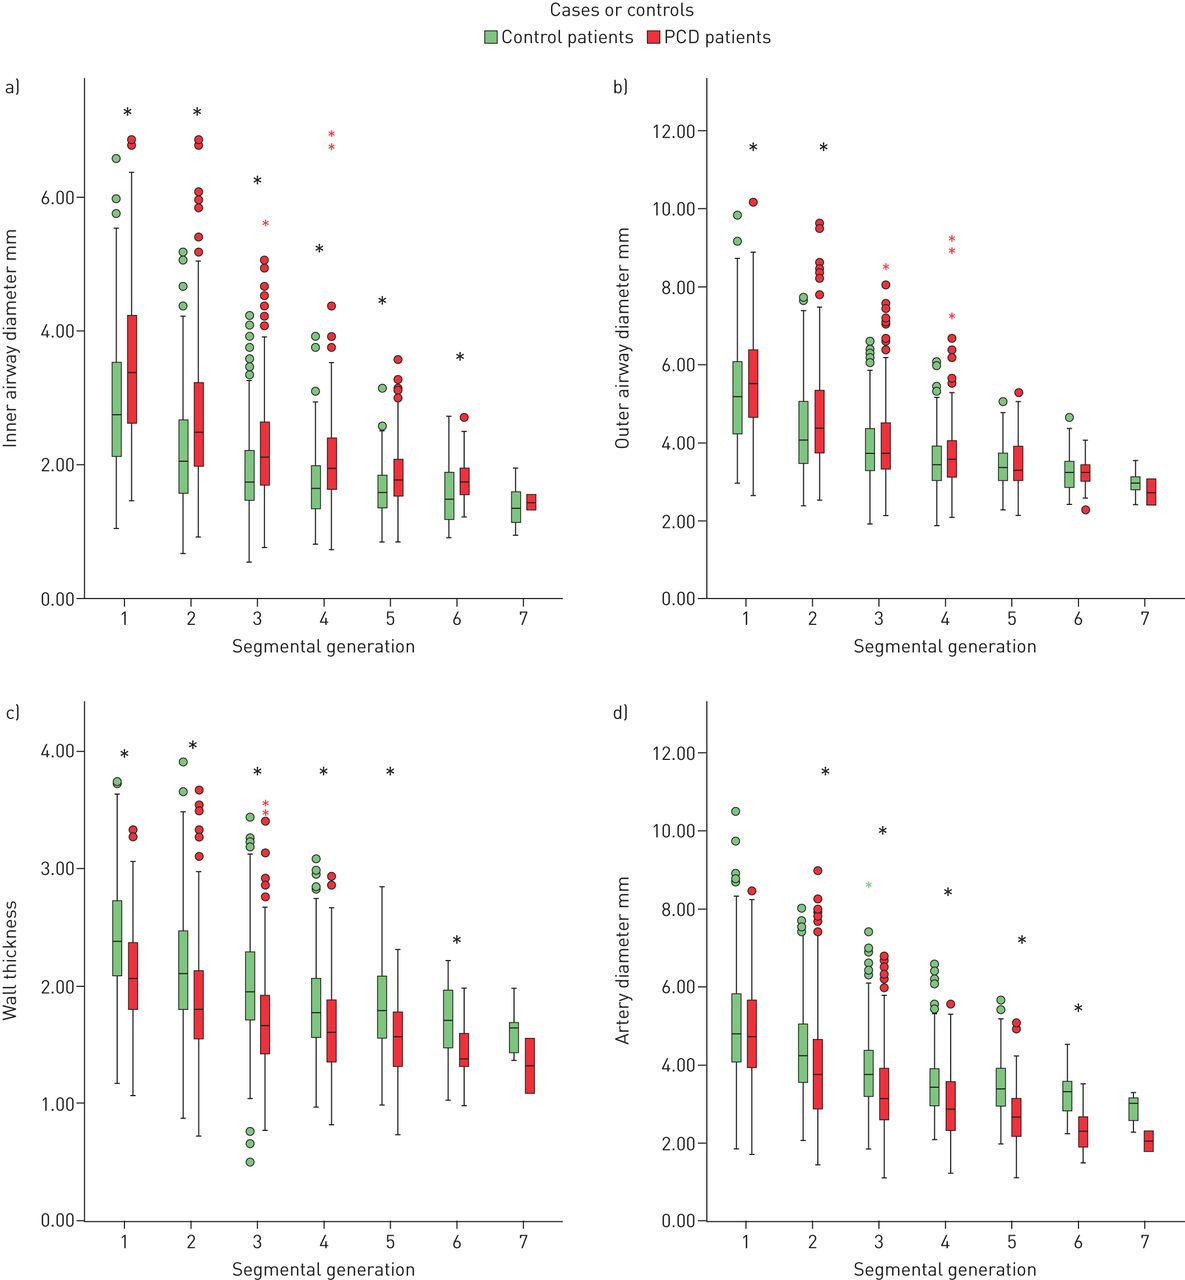
Comparing AA dimensions by segmental generations, median values of the inner airway diameter were significantly higher in PCD patients than in controls (p<0.001) and outer diameter was higher in segmental generation 1 and 2 (p=0.026–0.010, respectively); in segmental generations 3 to 6 the outer diameter was not significantly different between PCD and control patients (supplementary table A4, figure 4). Median values of WT and of arterial diameter were significantly lower in PCD patients than in controls (both p<0.001) (supplementary table A4, figure 4).

Box plots of a) inner airway diameter, b) outer airway diameter, c) wall thickness and d) artery diameter of primary ciliary dyskinesia (PCD) and control patients, divided according to different segmental generation. Each box shows median (horizontal line), interquartile range (solid box), 1.5×interquartile range (whiskers) and outliers (points and stars). *: statistically significant (p<0.05).
Airway–artery ratios
Analysing AA ratios in different segmental generations, median values of AinA ratio and AoutA ratio were significantly higher in PCD patients than in controls (p<0.001) (supplementary table A5, figure 5). Median values of Awt ratio were significantly lower in PCD patients than in controls (p≤0.001) (supplementary table A5, figure 5).

Box plots of airway–artery ratio of primary ciliary dyskinesia (PCD) and control patients, divided according to different segmental generation. Each box shows median (horizontal line), interquartile range (solid box), 1.5×interquartile range (whiskers) and outliers (points and stars). AinA: inner airway diameter/artery diameter; AoutA: outer airway diameter/artery diameter; Awt: airway wall thickness/outer airway diameter; AwtA: airway wall thickness/artery diameter. *: statistically significant (p<0.05).
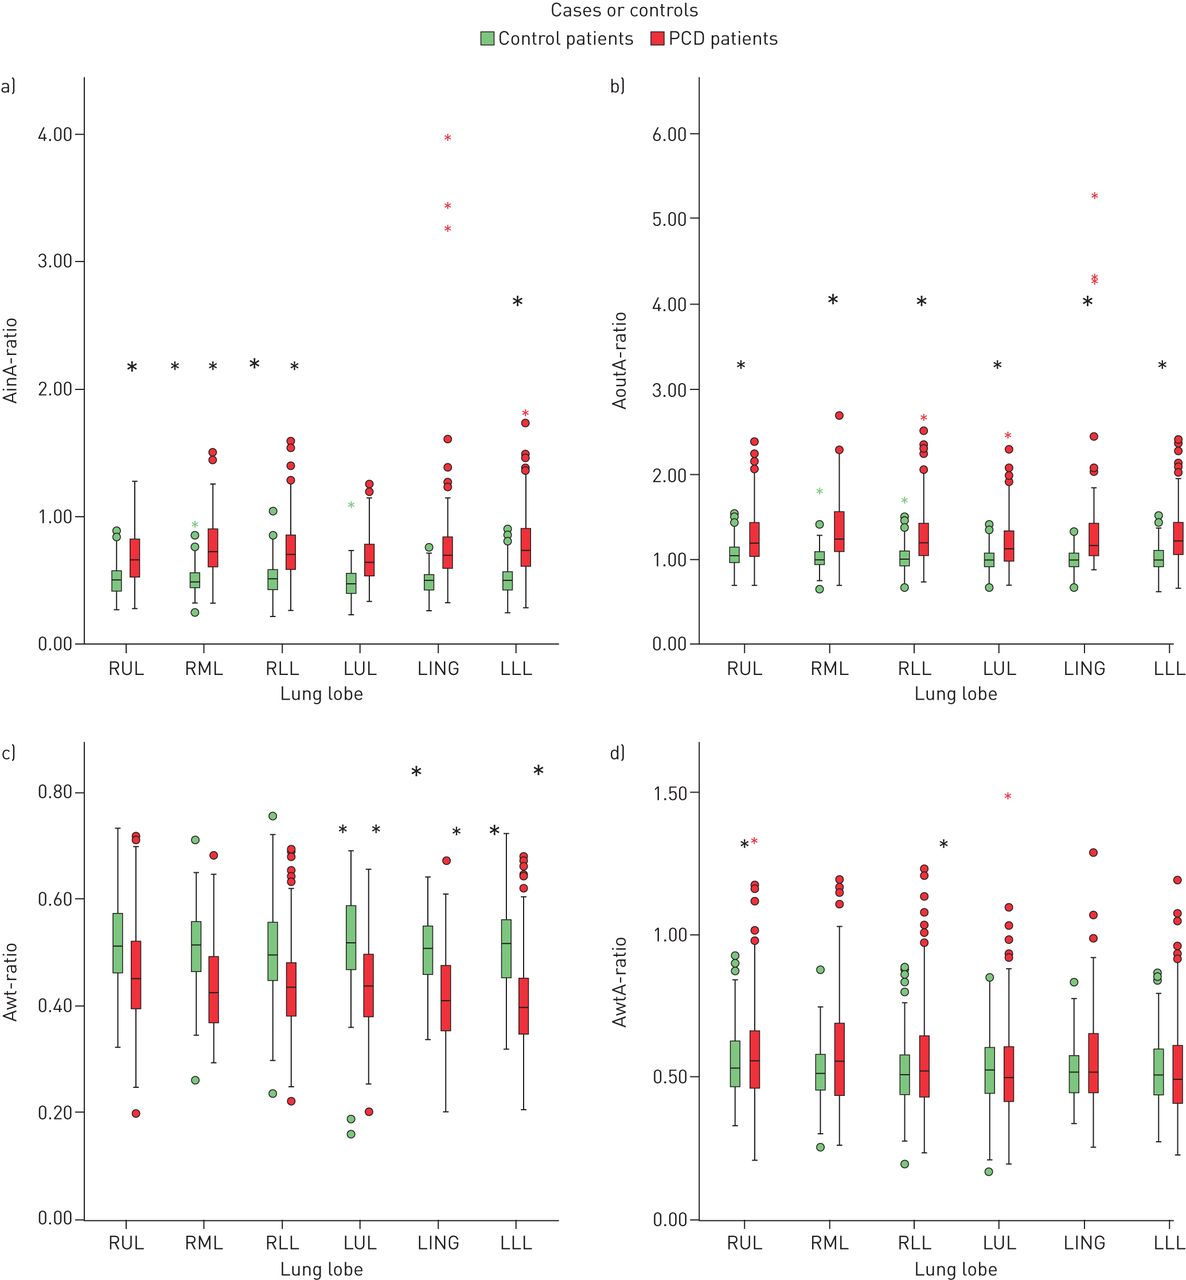
Analysing AA ratios in different lung lobes, median values of AinA ratio and AoutA ratio were significantly higher in PCD patients than in controls in all the different lobes (p<0.001) (supplementary table A6, figure 6).
Box plots of airway–artery ratio of primary ciliary dyskinesia (PCD) and control patients, divided according to different lung lobes. Each box shows median (horizontal line), interquartile range (solid box), 1.5×interquartile range (whiskers) and outliers (points and stars). AinA: inner airway diameter/artery diameter; AoutA: outer airway diameter/artery diameter; Awt: airway wall thickness/outer airway diameter; AwtA: airway wall thickness/artery diameter. *: statistically significant (p<0.05).
Median values of Awt ratio in the different lung lobes were significantly lower in PCD patients than in controls in all the different lobes (p<0.001) (supplementary table A6, figure 6).
Influence of covariates
In PCD patients, we did not find any correlations between AinA ratio, AoutA ratio, Awt ratio and AwtA ratio and the covariates age at CT (r2<0.1), age at diagnosis (r2<0.1), FEV1 (r2<0.1) and FEF75% (r2<0.1).
Reproducibility of airway measurements
For the intra-observer variability in PCD patients, ICC for AA dimensions were: inner airway 0.911 (95% CI 0.840–0.945); outer airway 0.908 (95% CI 0.882–0.928); airway WT 0.890 (95% CI 0.864–0.911); artery 0.926 (95% CI 0.907–0.941).
For the intra-observer variability in control patients, ICC for AA dimensions were described by Kuo et al. [21] as follows: inner airway 0.69; outer airway 0.72; airway wall 0.66; artery 0.926.
For the inter-observer variability in control patients, ICC for AA dimensions were: inner airway 0.747 (95% CI 0.689–0.795); outer airway 0.774 (95% CI 0.721–0.818); airway wall 0.695 (95% CI 0.628–0.752); artery 0.742 (95% CI 0.683–0.791).
Discussion
This is the first study that quantitates AA dimensions on chest CT in children with PCD and compares these dimensions with those in control subjects.
The most striking finding of our study is that, in PCD patients, airways are more dilated but do not show WT. Focusing on artery diameters, PCD patients show lower diameters than controls.
Our study showed that the number of measured AA pairs is not significantly different in PCD patients compared to controls, both in the lungs as a whole, in different segmental generations and lung lobes. This finding suggests that in PCD patients, airways are not thickened, even if the number of visible AA pairs might be influenced by low attenuation regions found in the majority of the PCD scans.
Airways and arteries
We showed that inner and outer airway diameters and corresponding ratio (AinA ratio and AoutA ratio) are significantly higher in PCD patients than in controls. In adults the definition of bronchiectasis is based on an AA ratio of more than 1, whereas in children it is not clear if identical cut-offs can be used [20, 21]. Also, there is no clear consensus whether inner or outer airway diameters should be used [35]. However, recent studies demonstrated that AoutA ratio is more reliable than AinA ratio for the diagnosis of bronchiectasis [18, 21, 22, 35]. In our study we found that in PCD patients airways are dilated (both AinA ratio and AoutA ratio) and this widening can reflect diffuse pre-bronchiectasis or bronchiectasis [27].
In our study, surprisingly, WT was significantly lower in PCD patients than in controls. The Awt ratio and AwtA ratio are more precise measurements of WT and they should be interpreted as pathological if they are more than 20% and more than 33%, respectively [24, 25]. In our dataset PCD patients had significantly lower Awt ratios than controls, but both the median values were higher than 0.20 (0.43 and 0.51 respectively); in contrast, the analysis of AwtA ratio did not show any significant differences in the two groups, even if both the median values were higher than 0.33 (0.52 both). This might be because bronchiectasis may lead to airway wall thinning in PCD patients. It should be considered that, WT in our PCD patients was compared to controls, who had a CT on clinical grounds. Their CTs were evaluated as being normal by two independent blinded radiologists. However, controls were not healthy and subtle changes in airway or artery dimensions might still be present.
Furthermore, the different results obtained between Awt ratios and AwtA ratio have to be considered given that in our study artery diameter is lower in PCD patients than in controls. We hypothesise that hypoxic pulmonary vasoconstriction, induced by hypoventilation in specific parenchyma region (e.g. as result of mucus plugging), may account for this, as shown in previous studies in interstitial lung diseases [36]; however, this could not be corroborated in our CT scans, because the method we applied does not quantify mucus plugging. Artery diameter could also be influenced by low attenuation regions found in the majority of the PCD scans, given that these areas are characterised by hypoxic vasoconstriction. The difference in artery diameters between controls and PCD patients might also be explained by endothelial disfunction and consequent vasodilatation in our nonhealthy control patients, who were mostly asthmatic, even if they had a normal CT scan [37].
Covariates
Our study did not show any correlations between AinA ratio, AoutA ratio, Awt ratio and AwtA ratio and age at CT or at diagnosis. The lack of correlation between age and CT abnormalities could be due to the young median age of our patients, the low number of patients included and to the differences in ciliary abnormalities; furthermore, the age at diagnosis in our dataset (median age 1.7 years) is lower than described by a European survey (median age 5.3 years) [38], therefore patients were treated from early life onwards. In the only patient with two CT scans 3 years apart, there was no progression of disease (AinA ratio, AoutA ratio, Awt ratio and AwtA ratio).
Reproducibility of airway measurements
Our study showed good and very good inter- and intra-observer agreements and that variability is due to the difficulties the observers have with manual measurements, which are impossible to be measured at identical anatomical locations.
Limitations
First, control subjects were not healthy, because radiation risk prevents CT scanning in healthy children. Although the underlying disease may have influenced AA dimensions, their CT scans were reported to be normal by two independently blinded radiologists.
A second limitation is that our population is small. To make a larger study feasible, AA measurements have to be automated, as the manual method is very time consuming (average of 12–15 h per scan). A bigger study might also allow to study covariates as age, different PCD phenotypes and microbiological results. Furthermore, the analysis of a longitudinal cohort of PCD patients should help us to study disease progression.
Third, occluded airways were not included in AA comparisons. On a chest CT it is not possible to measure airway dimensions in case there is mucus plugging or atelectasis.
Conclusion
Our study showed that in children with PCD airways are more dilated but do not show thickening. Focusing on artery diameters, children with PCD show lower diameters than controls. Last, in children with PCD we did not find any correlations between AA ratios and age at CT or age at diagnosis.
Supplementary material
Supplementary Material
Please note: supplementary material is not edited by the Editorial Office, and is uploaded as it has been supplied by the author.
Supplementary material 00210-2019.supplement
Footnotes
This article has supplementary material available from openres.ersjournals.com
Conflict of interest: V. Ferraro has nothing to disclose.
Conflict of interest: E-R. Andrinopoulou has nothing to disclose.
Conflict of interest: A.M.M. Sijbring has nothing to disclose.
Conflict of interest: E.G. Haarman has nothing to disclose.
Conflict of interest: H.A.W.M. Tiddens reports unconditional research grants outside the submitted work from Roche, Novartis, CFF, Vertex, Chiesi, Vectura and Gilead; he has participated in the last 5 years in expert panels for Vertex and Gilead. In addition, Dr Tiddens has a patent licensed for the PRAGMA-CF scoring system. He heads the Erasmus MC–Sophia Children's Hospital core laboratory Lung Analysis. FLUIDDA has developed computational fluid dynamic modelling based on chest CTs obtained from Erasmus MC–Sophia for which royalties are received by Sophia Research BV. All financial aspects for the grants are handled by Sophia Research BV.
Conflict of interest: M.W.H. Pijnenburg has nothing to disclose.
- Received August 20, 2019.
- Accepted May 26, 2020.
- Copyright ©ERS 2020
This article is open access and distributed under the terms of the Creative Commons Attribution Non-Commercial Licence 4.0.
References


