


Abstract
Background Asthma exacerbations increase in September coinciding with children returning to school. The aim of this study was to investigate whether this occurs 1) for COPD and respiratory tract infections (RTIs); 2) after school resumes in January and March; and 3) identify which viruses may be responsible.
Methods Emergency department (ED) visits and admissions for asthma, COPD and RTIs and the prevalence of viruses in Ontario, Canada were analysed daily between 2003 and 2013. ED visits and admissions were provided by the Canadian Institute for Health Information. Viral prevalence was obtained from the Centre for Immunisation and Respiratory Infectious Diseases.
Results ED visits and admissions rates demonstrated a biphasic pattern. Lowest rates occurred in July and August and the highest rates in September for asthma, and after December for COPD and RTI. The increase in rates for 30 days before and after school return in September was greatest for children with asthma <15 years (2.4–2.6×). Event rates fell after school return in January for all three conditions ranging from 10–25%, and no change followed March break for asthma and COPD. Human rhinovirus was prevalent in summer with a modest relationship to asthma rates in September. The prevalence of respiratory syncytial virus, influenza A and coronavirus was associated with sustained event rates for COPD and RTIs.
Conclusions Asthma, COPD and RTIs increase in September but do not occur after return to school in January and March. Human rhinovirus is associated with ED visits and admissions only in September.
Abstract
Asthma, COPD and RTIs increase in September but do not occur after return to school in January and March. Human RV is associated with ED visits and admissions only in September. https://bit.ly/3jEy168
Introduction
September is a worrying month for patients with asthma as it has been demonstrated in multiple jurisdictions that rates of asthma exacerbations increase after return to school after the summer vacation [1–6]. In Ontario, Canada a peak in asthma exacerbations requiring hospitalisation occurs among school-aged children 2–3 weeks after school resumes [7, 8]. This is followed approximately 1 week later by smaller increases in rates of asthma exacerbations in preschool-aged children and adults [8]. The hypothesised explanations for these observations were that exacerbations during this period are due to viral respiratory pathogens that first infect schoolchildren and are then transmitted by them to younger children and adults [8].
In the context of the current COVID-19 pandemic, children exposed to viral respiratory pathogens upon returning to school in September will be a serious public health concern. Children are less seriously affected by the SARS-CoV-2 virus than adults [9–11], but can spread to vulnerable populations such as the elderly, particularly given that asymptomatic carriers spread the disease is a major concern [12–15]. Patients with asthma have generally been under-represented in the current pandemic in large case series [16–18]. The predictable peak in September due to virally induced asthma raises concerns as to other respiratory conditions such as COPD and respiratory tract infections (RTIs). These may be more important as they affect the elderly more severely than the young with higher rates of hospital admission and increased mortality [19, 20].
Whether a September epidemic for COPD and RTI occurs is unknown. Viral spread would be equally expected on return to school in January after the Christmas holiday, and in March after the spring break holiday.
The objectives of this study were to investigate the daily rates of emergency department (ED) visits and admissions for asthma, COPD and RTI in the province of Ontario, Canada between 2003 and 2013: 1) in each month of the year; 2) during the return-to-school periods in September, January and March; and 3) to examine their relation to the community prevalence of respiratory viruses in those periods. We also wished to examine whether any sequences of exacerbation peaks between age groups occurred. Such insights into prior patterns of putative transmission of respiratory viruses and disease patterns that may be related to them should inform careful monitoring of the incidence of respiratory events in primary care following opening of schools this September and the development of contingency plans if increases in rates of respiratory morbidity are detected.
Methods
Data acquisition
The Centre for Immunisation and Respiratory Infectious Diseases collects data reported to the “The Respiratory Virus Detection Surveillance System” by laboratories across all provinces in Canada. The number of nasopharyngeal swabs performed for respiratory virus detection and the number positive for each virus was obtained from data reported weekly by 6 hospital laboratories and 11 public health laboratories in the province of Ontario for the period 2003–2013. The swabs are taken at either family physician offices, urgent care centres or hospital EDs. The multiplex PCR panel included influenza A and B, respiratory syncytial virus (RSV), parainfluenza and adenovirus until 2010, after which the panel was expanded to include human metapneumovirus (hMPV), human rhinovirus (hRV), and coronavirus.
The number of ED visits and admissions each day with asthma (ICD-10 J45), COPD (J40–44, J47), and RTI (J00–J06, J09–J18, J20–22) recorded as a primary diagnosis between 2003 and 2013 were acquired from the Canadian Institute for Health Information. Prevalence data for asthma were obtained from Statistics Canada and The Ontario Asthma Surveillance Information System. Data for the population size of Ontario were obtained from Statistics Canada.
Virus detection
Healthcare workers in Ontario performed the nasopharyngeal swabs on patients during routine clinical care. Specimens were processed at hospital or a public health laboratory and viruses were detected by multiplex PCR. The number of tests performed and the number positive for each virus is reported by the Centre for Immunisation and Respiratory Infectious Diseases on a weekly basis.
Statistical analysis
The daily rates for ED visits and admissions for asthma, COPD, and RTI were determined by expressing the number of events each day as a proportion of the population of Ontario at that time per 100 000 (105) and then taking the mean across each month of the year to obtain the average rate in five different age groups (<5, 5–15, 15–50, 50–70, and >70 years). The analysis for COPD was conducted only for 15–50, 50–70 and >70-year age groups. To assess the effect of children returning to school, the average event rate 30 days before and after the first day back to school in September, January and after March break holidays was assessed. The dates for the first day of school return after these breaks between 2003 and 2013 was obtained from the Ontario Ministry of Education.
The positive response rates for each respiratory virus was calculated by dividing the number of tests positive for each virus by the total number of tests performed and was expressed as the average response rate for each month of the year by averaging across all years (11 years of data for influenza A and B, RSV, parainfluenza, and adenovirus and 3 years of data for hMPV, hRV and coronavirus). The average positive response rate for each respiratory virus in the pre- and post-school vacation periods was determined by averaging the response rate over the 30 days before and after the day that school resumed. All daily rates are described in doubling logarithmic units per 105 to allow easier recognition of the relative rates across age, months and condition. All analyses and graphs were performed in TIBCO Statistica (Academic Package v.13.2).
Results
Overall daily ED visits and admissions
The population of Ontario increased from 12 251 405 in 2003 to 13 606 541 in 2013. There were 649 666 ED visits for asthma, of which 68 626 (10.6%) were hospitalised; 817 141 ED visits for COPD, of which 260 665 (31.9%) were hospitalised; and 4 365 578 ED visits for RTIs, of which 321 719 (7.4%) were hospitalised. The contribution of virus, age, and sex to ED visits and admissions has been described previously [21].
Daily rates of ED visits and admissions throughout the whole year
Asthma
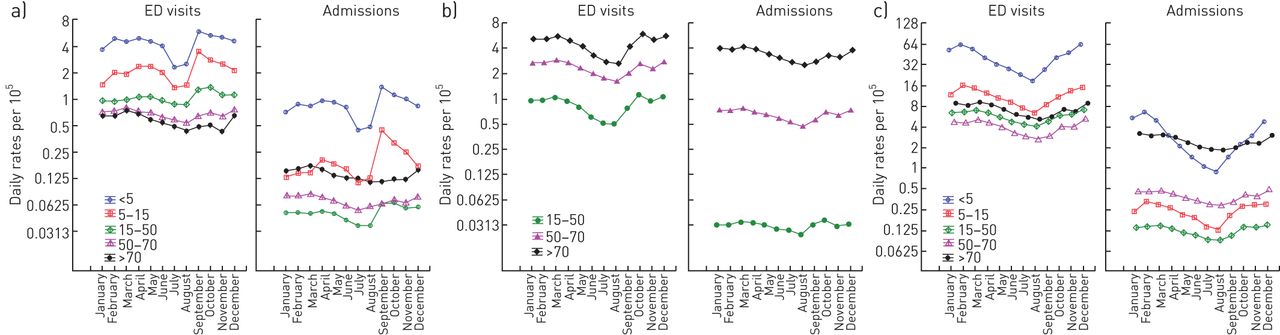
The mean daily number of ED visits and admissions for asthma throughout the year demonstrated a biphasic pattern in the <5, 5–15, and, to a lesser extent, the 15–50-year age categories for both ED visits and admissions (figure 1a). The nadir for ED visits and admissions in children <5 and 5–15 years was in July (ED visits: 2.28 per 105 and 1.35 per 105, admissions: 0.44 per 105 and 0.11 per 105, respectively) with a 2.4-fold increase occurring in September in both age groups. The rates in all children <15 years steadily decreased after September until January and was similar from February to June. In all months, the daily rate of ED visits was always highest in the youngest age group and declined with age.

Mean daily rates of emergency department (ED) visits and admissions per 105 persons by month of the year from 2003 to 2013 for a) asthma, b) COPD, and c) respiratory tract infections (RTIs). The y-axis is expressed on a log2 scale and is eight-fold greater for RTIs. Error bars represent 95% confidence intervals.
Rates of admissions followed a similar pattern with a nadir in July and August, and increased in September in the <5 (2.9×), 5–15 (3.5×) and near-doubling increase in the 15–50-year age group (1.8×). The proportion of ED visits that resulted in admission was consistently highest in the >70-years group throughout the year at 23%, with no further increase in September. In contrast, the proportion hospitalised increased only in the <5 (23% in September versus 18–20% for the rest of year) and 5–15-year age groups (13% in September versus 7–8% for the rest of year).
COPD
ED visits and admissions increased with age and demonstrated a biphasic response with a nadir in August in all age groups: 15–50, 50–70 and >70 years (0.49, 1.60, 2.59 per 105, respectively; figure 1b). This was followed by increases in ED visits in September in all three age groups; 15–50, 50–70, >70 years (1.6×/1.3×/1.6×) and October (1.4×/1.3×/1.4×), which was sustained until March (figure 1b).
Relative to ED visits, the proportion admitted was highest in those >70 years throughout the year (55–99%) compared to 15–50 (3–5%) and 50–70 years (26–29%).
Respiratory tract infections
ED visits and admissions followed a similar monthly pattern with a nadir in August over all the age categories but with far higher rates than asthma or COPD (figure 1c). ED visits with RTIs were lowest in August in all age groups: <5, 5–15, 15–50, 50–70, >70 years (18.6, 6.3, 4.0, 2.7, 5.2 per 105, respectively) and increased monthly from September till December and was sustained until peaking in February. The greatest single monthly increase was in October for all five age categories (1.5×/1.3×/1.2×/1.4×/1.3×, respectively).
Admissions were highest in the <5 and >70 years but with a pronounced biphasic monthly pattern in the <5 but not seen in the >70-year age group. Admissions were relatively infrequent in patients aged 5–70 years (0.1–0.5 per 105). Relative to ED visits, the proportion admitted was highest in the >70-year group throughout the year (33–36%), and lowest in 5–15 (2%), 15–50 (2%), and 50–70-year groups (10%) with minor monthly variations. The proportion of ED visits that led to admission in the <5-years group ranged from 10% in January and February and halved to 5% between June and October.
Daily rates for ED visits and admissions before and after school return
Asthma
The highest proportionate increase in ED visits and admissions for asthma occurred within 30 days after return to school in September in children <5 and 5–15 years (ED visits: 2.4×/2.6×; admissions: 2.8×/3.8×, respectively; figure 2). The proportionate increase in ED visits and admissions in September decreased as age group increased; 15–50, 50–70, >70 years (ED visits: 1.5×/1.3×/1.1×, admissions: 1.9×/1.1×/1.1×). After returning to school in January, ED visits declined with increasing age groups by 15–25% and admissions were either the same or declined. There were no changes in ED visits or admissions after the March break.
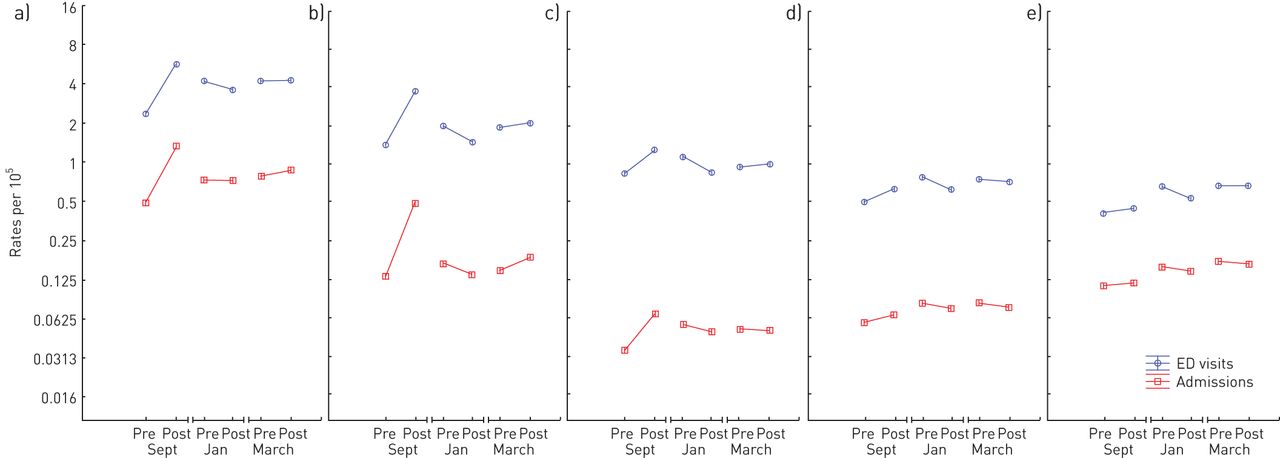
Asthma emergency department (ED) visit and admission rates per 105 persons averaged over the 30 days prior to (pre) and after (post) return to school after the summer (Sept), winter (Jan), and spring (March) vacation periods. a) Age <5 years; b) age 5–15 years; c) age 15–50 years; d) age 50–70 years; e) age >70 years. The y-axis is expressed on a log2 scale. Error bars represent 95% confidence intervals.
COPD
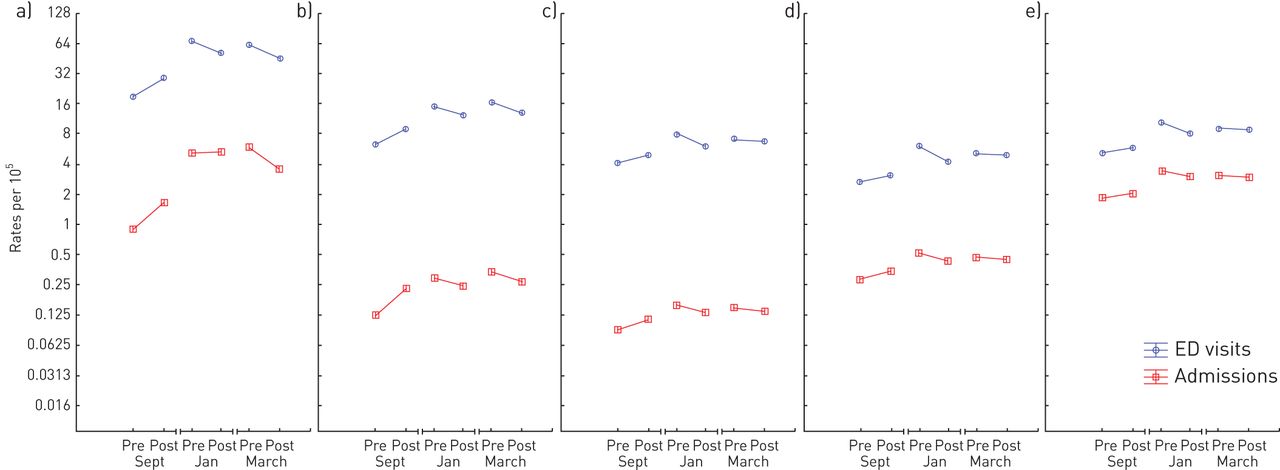
The highest proportionate increase in ED visits and admissions for COPD occurred within 30 days after children had returned to school in September in age groups 15–50, 50–70, >70 years (ED visits: 1.7×/1.3×/1.7×; admissions: 1.3×/1.3×/1.1×, respectively, figure 3). After children returned to school in January, ED visits and admissions declined proportionately in all three age groups by 20% and 10% respectively. There were no changes in ED visits or admissions after the March break.

COPD emergency department (ED) visit and admission rates per 105 persons averaged over the 30 days prior to (pre) and after (post) return to school after the summer (Sept), winter (Jan), and spring (March) vacation periods. a) Age 15–50 years; b) age50–70 years; c) age >70 years The y-axis is expressed on a log2 scale. Error bars represent 95% confidence intervals.
Respiratory tract infections
The greatest proportionate increase in ED visits and admissions for RTIs occurred within 30 days after children returned to school in September and decreased as age group increased; <5, 5–15, 15–50, 50–70, >70 years (ED visits: 1.5×/1.4×/1.2×/1.2×/1.1×, respectively; admissions: 1.8×/1.9×/1.3×/1.2×/1.1×, respectively; figure 4). After children returned to school in January, ED visits declined in all age groups by 20% and admissions were either the same (<5) or declined (5–50: 20%, >70: 10%). After the March break, ED visits and admissions declined in age groups <5, 5–15, 15–50 (ED visits: 30%, 20%, 10%, admissions: 40%, 20%, 10%) and was the same in the >50-year group.

Respiratory tract infection emergency department (ED) visit and admission rates per 105 persons averaged over the 30 days prior to (pre) and after (post) return to school after the summer (Sept), winter (Jan), and spring (March) vacation periods. a) Age <5 years; b) age 5–15 years; c) age 15–50 years; d) age 50–70 years; e) age >70 years. Error bars represent 95% confidence intervals.
Peaks in ED visits and admission in September
The rates of ED visits and admissions 30 days after children's school return were assessed for all age group and conditions to evaluate the relationship between peak rates (figure 5). The peak in children <15 with asthma was on day 13 (figure 5a), with a slow gradual increase in daily rates for all other age groups, with no obvious peak. The pattern was the same for COPD (figure 5b) and RTI (figure 5c); however, rates continued to increase beyond September. Of interest, there was a progressive increase in all event rates for asthma and RTI in the younger group peaking on a Sunday.

Mean daily rates of emergency department visits and admissions per 105 persons within 30 days of return to school for a) asthma, b) COPD, and c) respiratory tract infections. The y-axis is expressed on a log2 scale and is eight-fold greater for RTIs. Error bars represent 95% confidence intervals. Dashed line indicates peak for <5 and 5–15-year age group.
Prevalence of respiratory viruses each month of the year and relative to school return
Overall, there were 462 823 multiplex PCR tests performed and collected in the Ontario Canadian Viral Surveillance Program between 2003 and 2013 for five respiratory viruses (influenza A/B, RSV, parainfluenza, adenovirus). In addition, there were 79 511 tests performed and reported between 2010 and 2013 for three additional viruses (hRV, hMPV and coronavirus).
hRV was the most prevalent virus for 7 months of the year and started to increase in March and peaked in September/October (figure 6). RSV, influenza A were the dominant virus for 4 months from December to March, and started to increase in October and peaking in February. Parainfluenza viruses followed a similar pattern to hRV. Adenovirus did not vary throughout the year. Coronavirus, hMPV and influenza B mirrored influenza A but at lower rates.

Proportion of nasopharyngeal swabs positive for each virus by month. The y-axis is expressed on a log2 scale. Error bars represent 95% confidence intervals. #: Viruses that were available only between 2010 and 2013.
Relative to 30 days before and after school return in September, only hRV increased, whilst the other viruses either declined to remained the same (figure 7). In January, the prevalence of RSV, influenza A, coronavirus, hMPV, influenza B increased in the community. hRV, adenovirus and parainfluenza all decreased. After March break, RSV, influenza A, coronavirus all decreased, whilst hMPV, hRV, parainfluenza increased modestly in the community.

Proportion of nasopharyngeal swabs positive for each virus averaged over the 30 days prior to (pre) and after (post) return to school after the summer (September), winter (January), and spring (March) vacation periods. The y-axis is expressed on a log2 scale. Error bars represent 95% confidence intervals. #: Viruses that were available only between 2010 and 2013.
Discussion
This report is of a retrospective analysis over an 11-year period of ED visits and hospital admissions occurring in the province of Ontario, Canada and their relation to the community detection of respiratory viruses. These data highlight some important observations: 1) the increase in ED visits and admissions in September is preceded by the lowest yearly rates in July and August for asthma, COPD and RTIs; 2) the increase is most pronounced in children with asthma <15 years and occurs only after return to school in September within 14 days, but event rates fall or are similar following school return in January and March for all ages and condition; 3) rates for RTIs and COPD are orders of magnitude higher than asthma throughout the year; and 4) hRV is associated with an increase in rates only in September, whilst influenza A, RSV and coronavirus is associated with sustained high rates for COPD and RTI between October and March.
Observations that seasonal and monthly variations in asthma, COPD, RTIs or detections of respiratory viruses have been previously described [6, 22–26], however, the data from this study show that September is unusual because it is the month in which the highest increases for RTI and COPD also occur, not just asthma. Furthermore, analysis across all months shows that although September represents the peak in children under 15 years old with asthma, rates continue to increase for COPD and RTIs, and remain high until March. The reasons for the rise in September are unclear. Return to school is one possible explanation; however, these data challenge this supposition, as we found no increase in rates of ED visits or admissions for any condition after return to school in January or March. This is particularly interesting because: 1) rates of community viruses such as influenza A, RSV and coronavirus are on the rise in December and January; 2) the Christmas period is associated with mixing between friends and family of multiple generations, increasing the likelihood of viral transmission; and 3) rates increase for children <15 years within the first 14 days on return to school and then begin to fall, yet rates in all other age groups and condition continue to rise well beyond September. Alternative explanations that have been highlighted include reduced adherence to medication in August [27], changes in weather [28], colder temperatures [24, 29], humidity [30] and pollution [31] and returning from holiday travel. However, this is unlikely in Ontario, as previous evidence suggests the September epidemic is independent of the degree of urbanisation and geographical location [8, 32].
Allergen exposure is commonly considered as a risk factor for asthma exacerbations [33]. The ragweed season in Ontario, Canada starts in mid-August and allergic asthma is the more common in school age children. Hence it is plausible that the combination of allergen exposure and hRV cause the increase rates in September, rather than return to school. Evidence supporting this hypothesis comes from studies showing exposure to rhinovirus after allergen exposure shows increases risk of exacerbations [34, 35] and a greater degree of bronchoconstriction [36]. Opposing this view is the fact that is no increase in asthma ED visits and admissions occur between April and August, which corresponds with tree and grass pollen seasons even though the percentage positive tests for hRV is increasing. We speculate that although hRV is being detected between April and August, the virus may not be as pathogenic resulting milder disease which might result in an ED visit. This explains why the strength of the relationship with hRV in the community is not as strong as might be expected [21]. Secondly, this does not explain why rates also increase for COPD and RTIs, which are generally not mediated by allergen exposure.
The effect of changes in emotion and stress on perceptions of symptoms and visits to ED for asthma, COPD and RTI is unclear. The increase in September for all conditions is preceded by falling rates in July and August. The increase was greatest in school-aged children under 15 years, raising the possibility that the start of the summer holidays lasting at least 8 weeks is associated with a reduction in stress and anxiety, whilst the start of school in September the opposite. We would also speculate that children under 5 years may be in a daycare or nursery facility and hence show similar pattern to school-aged children. Children at home may have siblings at school with who they are interacting. Our data show that Sunday had the highest rates of for asthma and RTI for children under 15 years, suggesting that the availability and threshold of parents to take children to hospitals for assessment may also be an important contributor.
Psychological triggers have been shown to be associated with a decrease in asthma control, greater medical treatment, and ED visits [37–39]. Mood changes, attention, and perception of symptoms have all been shown to impact symptom [40–44] and poor symptom perception is associated with near-fatal asthma [45]. Experimentally evoked stress has been associated with greater bronchoconstriction [46], and increased stress during school examinations also enhances airway inflammation induced by antigen challenge [47]. This may to some extent explain the fall and rise of ED visits and admission for asthma and RTI after school ends in July and begins in September. However, why this occurs for COPD in the elderly over 50 and 70 years in this study needs further attention.
The pandemic has drastically changed human behaviour. Social distancing, reduced travel and widespread public use of personal protective equipment have become common, so it is unclear whether the same patterns observed over the previous years will be repeated. Despite these caveat, this study has some important clinical implications: 1) a potential second wave of infections in September and beyond is likely to involve other non-SARS-CoV-2 viruses and hence testing for symptomatic individuals of all ages should be performed using multiplex PCR panels that include traditional viruses; 2) the turnaround time for these multiplex PCR panels should be minimised despite the expected increase in respiratory virus testing in September to avoid strictly isolating those with confirmed non-SARS-CoV-2 viruses; and 3) provisions need to be made for the care of elderly patients with COPD and RTIs who are likely to have increased mortality from SARS-CoV-2 and already have high rates of hospital admission from usual respiratory viruses in the autumn and winter. This includes assessment of lung function and sputum cultures, which is currently extremely limited due to fear of aerosol generation.
Our study has several important limitations. First, the database recording daily rates of ED visits and admissions is not directly linked to the respiratory virus surveillance program or to individual level data, so it is difficult to assess comorbidities, medication and coinfection with multiple viral or bacterial pathogens. Furthermore, at best these are associations and not an inference of causation. Second, the number and cause of ED visits and admissions due to each condition were determined using the ICD-10 codes applied by physicians and administrators to each visit, so there is potential for misclassification, particularly of asthma in children under 5 years. The diagnosis of asthma under 5 years is very difficult to differentiate from viral-induced wheezing. Third, it is unlikely that we have not captured all infections as many milder cases will not attend ED. Fourth, we do not have a more detailed breakdown of the 15–50-year age group, as this would have been useful to differentiate those most likely to have COPD. Fifth, we do not have information about whether children under 5 years are in daycare or nursery. Six, laboratories validate their own multiplex PCR assays used for virus testing, though each laboratory undergoes audits for quality assurance that are conducted by The Institute for Quality Management in Healthcare.
Conclusions
There is an increase in ED visits and admissions in September every year in Ontario, Canada for asthma, COPD and RTI, which occurs within 30 days after return to school in September but not in January or March. The increase in September is associated with an increase in prevalence of hRV only, whilst for other months of the year, the dominant viruses are influenza A, RSV and coronavirus.
Footnotes
Author contributions: I. Satia, A. Adatia, N. Johnston, K.J. Killian and P.M. O'Byrne conceptualised and designed the study. I. Satia, A. Adatia, S. Yaqoob and K.J. Killian performed data analyses and interpretation. All authors had full access to all the data, and contributed data analysis, interpretation and writing of the manuscript.
Support statement: The research reported in this article was funded by an unrestricted grant from AstraZeneca Canada to P.M. O'Byrne, with no input in data collection, analysis, interpretation or writing of the manuscript. Funding information for this article has been deposited with the Crossref Funder Registry.
Data availability: All relevant data are included in the manuscript.
Conflict of interest: I. Satia reports personal fees from educational talks for general practitioners from GSK and AstraZeneca, grants and personal fees from Merck Canada, and a European Respiratory Society RESPIRE3 Marie Curie Fellowship, outside the submitted work.
Conflict of interest: A. Adatia reports grants from the Canadian Institutes for Health Research/Canadian Allergy, Asthma and Immunology Foundation/AstraZeneca/Allergen NCE outside the submitted work.
Conflict of interest: S. Yaqoob has nothing to disclose.
Conflict of interest: J.M. Greene has nothing to disclose.
Conflict of interest: P.M. O'Byrne reports grants and personal fees from AstraZeneca, personal fees from GSK, grants from Novartis, grants and personal fees from Medimmune, and personal fees from Chiesi, outside the submitted work.
Conflict of interest: K.J. Killian has nothing to disclose.
Conflict of interest: N. Johnston has nothing to disclose.
- Received August 17, 2020.
- Accepted August 18, 2020.
- Copyright ©ERS 2020
This article is open access and distributed under the terms of the Creative Commons Attribution Non-Commercial Licence 4.0.
References


