


Abstract
The concept that the small airway is a primary pathological site for all COPD phenotypes has been challenged by recent findings that the disease starts from the central airways in COPD subgroups and that a smaller central airway tree increases COPD risk. This study aimed to examine whether the computed tomography (CT)-based airway disease-dominant (AD) subtype, defined using the central airway dimension, was less associated with small airway dysfunction (SAD) on CT, compared to the emphysema-dominant (ED) subtype.
COPD patients were categorised into mild, AD, ED and mixed groups based on wall area per cent (WA%) of the segmental airways and low attenuation volume per cent in the Kyoto–Himeji (n=189) and Hokkaido COPD cohorts (n=93). The volume per cent of SAD regions (SAD%) was obtained by nonrigidly registering inspiratory and expiratory CT.
The AD group had a lower SAD% than the ED group and similar SAD% to the mild group. The AD group had a smaller lumen size of airways proximal to the segmental airways and more frequent asthma history before age 40 years than the ED group. In multivariable analyses, while the AD and ED groups were similarly associated with greater airflow limitation, the ED, but not the AD, group was associated with greater SAD%, whereas the AD, but not the ED, group was associated with a smaller central airway size.
The CT-based AD COPD subtype might be associated with a smaller central airway tree and asthma history, but not with peripheral lung pathologies including small airway disease, unlike the ED subtype.
Abstract
This study shows that airway disease-dominant COPD, defined using central airway dimension on CT, is associated with a smaller central airway tree, less small airway dysfunction and slower lung function decline than the emphysema-dominant COPD https://bit.ly/3nNwxIC
Introduction
COPD is characterised by limited airflow and causes morbidities and mortality worldwide [1]. Long-term exposure to noxious particles such as cigarette smoke induces structural alterations in both central large and peripheral small airways and parenchymal destruction that can be categorised into centrilobular emphysema (CLE), paraseptal emphysema (PSE) and panlobular emphysema [2, 3]. These pathological changes are combined heterogeneously in each patient, making it difficult to predict outcomes with simple assessments of each change.
Chest computed tomography (CT) is used to separately assess the airways and parenchyma and to identify airway disease-dominant (AD) and emphysema-dominant (ED) subtypes to account for the heterogeneous clinical manifestations [4–9]. While small airway disease, which is considered a main pathology of COPD [10–15], cannot be directly evaluated with CT due to the limited resolution, a finding by Nakano et al. [16] that the central airway dimension on CT reflects small airway disease on histology has rationalised CT assessments of central airways in patients with COPD.
The introduction of non-rigid registration of inspiratory and expiratory CT has enabled regions with small airway dysfunction (SAD) to be localised [17]. Vasilescu et al. [18] showed that the SAD on CT is closely associated with the remodelling and loss of terminal bronchioles on microCT in COPD. Labaki et al. [19] showed that regions with SAD on CT are subsequently converted into emphysema after 5 years, supporting the concept that the small airway is a primary pathological site for all COPD phenotypes [11, 12, 14, 20]. However, this concept has been challenged by recent findings that the disease starts from the central airways in COPD subgroups [21] and that a smaller central airway tree size relative to lung size, termed dysanapsis, is associated with greater COPD risk [22]. Moreover, a very recent microCT study showed that the terminal bronchioles were relatively preserved in PSE compared to in CLE [23].
We thus hypothesised that central airway disease might develop independently of peripheral lung disease in the AD subtype of COPD patients. For this goal, using two cohorts, the Kyoto–Himeji cohort and the Hokkaido COPD cohort [24–26], this study specifically aimed to prove that the classical CT-based AD subtype, defined using central airway dimension, would be less severe in the SAD compared with the ED subtype and have some distinct morphological and clinical features.
Methods
Study design
The details of this study are provided in the supplementary material. This study analysed the baseline data of a prospective observational study at the Kyoto University Hospital and Terada Clinic (Kyoto–Himeji cohort) and the cross-sectional and longitudinal data of the Hokkaido COPD cohort [24–26]. The Kyoto–Himeji cohort enrolled smokers aged ≥40 years with a smoking history of ≥10 pack-years but without a current diagnosis of asthma from April, 2018, to April, 2020. This study was approved by the Ethics Committee of Kyoto University (No.C1311) and registered with the University Hospital Medical Information Network (UMIN000028387). The Hokkaido COPD Cohort Study was approved by the Health Authority Research Ethics Committee of Hokkaido University School of Medicine (No.med02–001), and the inclusion and exclusion criteria are described elsewhere [24–26]. Patients with a prior history of asthma before age 40 years were included in the Kyoto–Himeji cohort but not in the Hokkaido COPD cohort. Each participant provided written informed consent.
CT acquisitions
In the Kyoto–Himeji cohort, full inspiratory and end-tidal expiratory CT were acquired using an Aquilion Precision scanner at Kyoto University and an Aquilion lightning scanner at Terada Clinic (Canon Medical Systems, Otawara, Japan). Images with a 1-mm slice thickness were reconstructed using soft (FC13) and sharp (FC51) kernels for parenchymal and airway analysis. A phantom that mimicked the parenchyma and airways was scanned to confirm that both scanners provided consistent measurements (supplementary figures S1 and S2). In the Hokkaido COPD cohort, full inspiratory and end-tidal expiratory CT were acquired using a Somatom plus Volume Zoom scanner (Siemens AG, Berlin, Germany), and images with a 1.25-mm slice thickness were reconstructed using standard (B30) and sharp (B60) kernels for parenchymal and airway analysis.
Analysis of CT images
Using SYNAPSE VINCENT software (FUJIFILM, Tokyo, Japan), the lung fields were automatically extracted. The volume percentage of regions showing CT values <−950 HU to total lung volume on inspiratory CT (LAV%) was calculated to evaluate emphysema severity [25] based on a report showing that the threshold of −950 HU provides the strongest correlation between the extent of emphysematous change on CT and microscopically measured emphysema severity [27]. Additionally, the expiratory lung images were nonrigidly registered onto the inspiratory lung images, and SAD was identified as voxels with CT values of −950 HU or more on the inspiratory CT and <−856 HU on the registered expiratory CT based on a report showing that SAD regions defined using the thresholds of −950 HU and −856 HU on inspiratory and expiratory CT, respectively, are closely associated with the pathological changes of small airways on microCT [18]. The volume percentage of SAD to the total lung (SAD%) was calculated [17]. The lumen, wall area and wall area per cent (WA%) of the segmental right apical and posterior basal bronchus (RB1 and RB10) were measured, and averaged [28]. For comparisons between the CT-based subtypes, lumen and wall areas were normalised by body surface area (BSA). CLE and PSE were visually assessed based on the Fleischner Society classification system [3]. The inter-rater variability of two analysts (NT and HS) in identifying PSE and CLE was excellent (κ=0.85 and 0.81).
Pulmonary function and clinical features
Post-bronchodilator spirometry was performed. The predicted forced vital capacity (FVC) and predicted forced expiratory volume in 1 s (FEV1) were calculated with the LMS method [29]. Respiratory symptoms were evaluated using the COPD Assessment Test (CAT) in the Kyoto–Himeji cohort. The St. George's Respiratory Questionnaire (SGRQ) [30] was administered, the annual decline in FEV1 over 5 years was calculated with a mixed-effects linear model and mortality over 10 years was evaluated in the Hokkaido cohort.
Statistics
The R statistical program was used [31]. Based on the inspiratory CT, the patients were categorised into four groups: 1) low WA% and low percentage of low attenuation volume (mild), 2) high WA% and low LAV% (AD), 3) low WA% and high LAV% (ED), and 4) high WA% and high LAV% (mixed). The LAV% cut-off was set as 10% to identify established emphysema [32, 33]. The WA% cut-off was set as 60% based on a previous report that showed the mean (sd) WA% in the right segmental airways of healthy nonsmokers was 58.1 (2.2)% [34]. To explore whether the AD, ED and mixed groups had additional, independent impacts on per cent of predicted FEV1 (FEV1 % pred), SAD% and the mean lumen area of right main and intermedius bronchus compared to the mild group, three multivariable linear regression models were constructed using the CT-based categories age, sex, smoking pack-years, body mass index (BMI) and CT scanners as independent variables.
Results
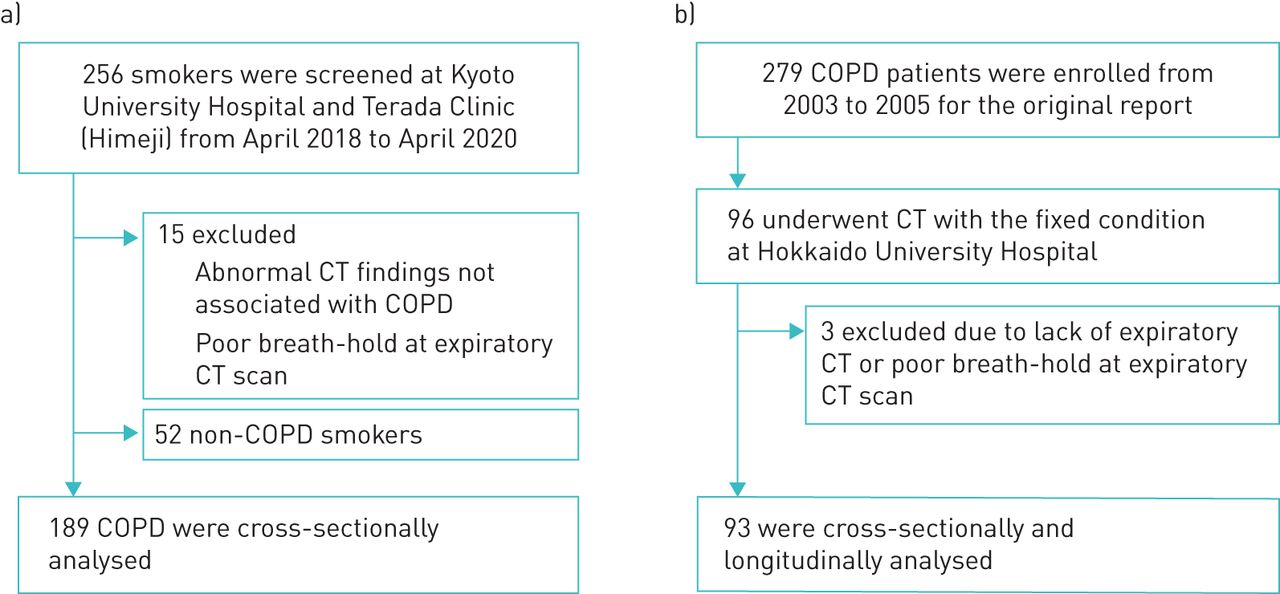
Figure 1a shows that in the Kyoto–Himeji cohort, of the 256 patients initially screened, 15 were excluded due to abnormal CT findings unrelated to COPD and insufficient breath-holds during the expiratory CT scan. 52 smokers who did not fulfil the diagnostic criteria of COPD were excluded, and a total of 189 patients were cross-sectionally analysed. Figure 1b shows that of the 279 patients included in the original report by Nishimura et al. [24] as the Hokkaido COPD cohort, this study cross-sectionally and longitudinally analysed 93 patients who underwent inspiratory and expiratory CT using the same scanner with fixed conditions at Hokkaido University Hospital. Table 1 shows the demographics of the two cohorts.

Patient inclusion flowchart. Patient inclusion flow charts for a) the Kyoto–Himeji cohort and b) the Hokkaido COPD cohort, for which the present study analysed inspiratory and expiratory computed tomography (CT).
Demographics of the two cohorts
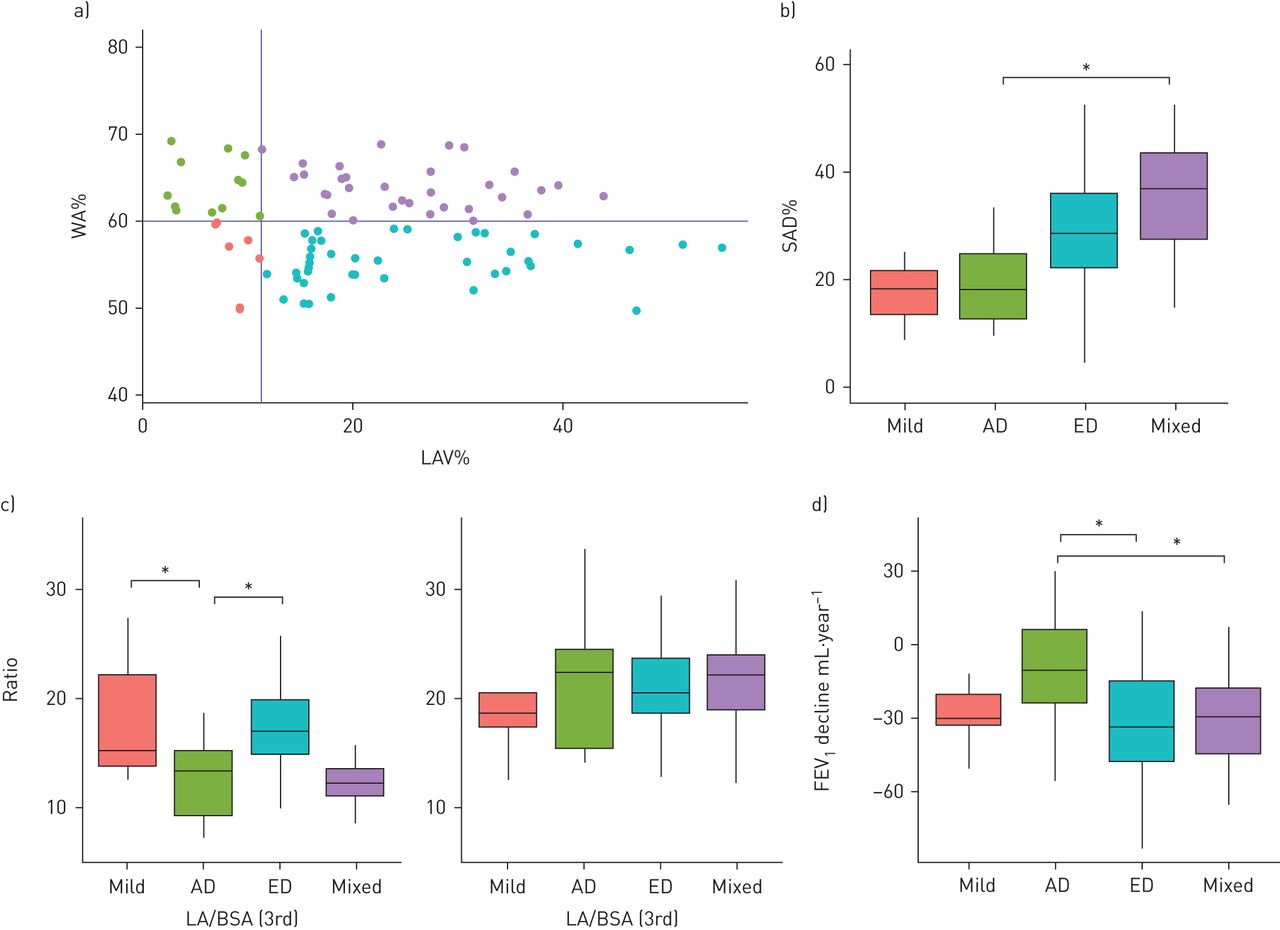
Figure 2a shows that 26%, 19%, 36% and 19% of COPD patients in the Kyoto–Himeji cohort were categorised into the mild (WA%<60% and LAV%<10%), AD (WA%≥60% and LAV%<10%), ED (WA%<60% and LAV%≥10%) and mixed (WA%≥60% and LAV%≥10%) groups (n=50/36/68/35), the clinical characteristics of which are shown in table 2. The AD group had a larger BMI than the ED and mixed groups and higher self-reported rates of a history of asthma before age of 40 years than the mild and ED groups. On the visual emphysema assessments, pure PSE CT findings were more frequent, and pure CLE and mixed CLE and PSE findings were less frequent in the AD group than in the ED group.

Small airway dysfunction in patients with the airway disease-dominant and emphysema-dominant phenotypes in the Kyoto–Himeji cohort. a) COPD patients in the Kyoto–Himeji cohort were categorised into mild, airway disease-dominant (AD), emphysema-dominant (ED) and mixed groups based on wall area per cent of the segmental bronchus (WA%) and low attenuation volume per cent (LAV%) on inspiratory computed tomography (CT). b) Small airway dysfunction per cent (SAD%) measured on a pair of inspiratory and expiratory CT scans and c) lumen area (LA) and wall area (WA) adjusted by body surface area (BSA) were compared between the groups. d) The mean LA of the airways proximal to the segmental airways, including the right main and intermedius bronchus, was adjusted by BSA and compared. * : p<0.05; and **: p<0.005 based on Tukey's multiple comparison tests.
Clinical characteristics of the CT-based airway disease- and emphysema-dominant phenotypes in patients with COPD in the Kyoto–Himeji cohort
Figure 2b shows that the SAD% did not differ between the mild and AD groups, whereas the SAD% was increased in the ED and mixed groups compared to that in the mild group. Figure 2c shows that the lumen area of the segmental airways was smaller in the AD group than in the mild and ED groups, whereas the wall area did not differ among groups. Figure 2d shows that the mean lumen area of more central airways, including the right main and intermedius bronchus, was smaller in the AD group than in the mild and ED groups. Supplementary figure S3 shows that the lumen areas of the segmental airways as well as those of airways proximal to the segmental airways were also smaller in the AD group than in the mild and ED groups even when comparing these lumen areas without adjustment and with adjustment by height. Supplementary figure S4 shows that CT inspiratory lung volume adjusted by the predicted value of total lung capacity was larger in the ED group than in the AD group, while no difference was found between the mild and AD groups.
Table 3 shows that in multivariable linear regression models, FEV1 % pred was significantly and similarly lower in the AD and ED groups compared to the mild group. In contrast, SAD% did not differ between the AD and mild groups, while SAD% was significantly higher in the ED group compared to the mild group. Moreover, the mean lumen area of right main and intermedius bronchus was significantly lower in the AD, but not in the ED, group compared to the mild group.
Multivariable analyses to explore associations of the airway disease-dominant and emphysema-dominant phenotypes with airflow limitation, small airway dysfunction and more proximal central airway lumen area in the Kyoto–Himeji cohort
The results of the Kyoto–Himeji cohort were validated in the Hokkaido COPD cohort. Figure 3a shows that 9%, 13%, 44% and 34% of COPD patients were categorised into the mild, AD, ED and mixed groups, respectively (n=8/12/41/32), the clinical data for which are summarised in table 4. The AD group had a larger BMI and tended to have higher rates of blood eosinophil count ≥300 μL−1 and atopy than the mild and ED groups, while bronchodilator response did not differ between the AD and ED groups. Figure 3b shows that SAD% did not differ between the mild and AD groups but was increased in the mixed group. Figure 3c shows that the lumen area of the segmental airways was lower in the AD group than in the mild and ED groups. Figure 3d shows that the annual decline in FEV1 over 5 years was significantly smaller in the AD group than in the ED and mixed groups. Supplementary figure S5 shows that the mean lumen area of the right main and intermedius bronchus tended to be smaller in the AD group than in the other groups and that the survival rate did not differ between the mild and AD groups.
Small airway dysfunction and clinical longitudinal outcomes in patients with the airway disease-dominant and emphysema-dominant phenotypes in the Hokkaido COPD cohort. a) COPD patients in the Hokkaido COPD cohort were categorised into mild, airway disease-dominant (AD), emphysema-dominant (ED) and mixed computed tomography (CT) subtypes. LAV%: low attenuation volume per cent. b) Small airway dysfunction per cent (SAD%) measured on a pair of inspiratory and expiratory CT scans and (c) lumen area (LA) and wall area (WA) adjusted by body surface area (BSA) were compared between the groups. d) Annual change in forced expiratory volume in 1 s (FEV1) were compared among the four groups. * indicates p<0.05 from Tukey's multiple comparison tests.
Clinical characteristics of the patients with the airway disease-dominant and emphysema-dominant phenotypes in the Hokkaido COPD cohort
Discussion
By using CT-based subtyping, this study showed that the SAD in the AD group was less severe than that in the ED group and was similar to that in the mild group in the two cohorts. In the multivariable models, while both the AD and ED groups showed similar reduction in FEV1, the AD group was associated with a smaller lumen of the main and intermedius bronchus, but not with SAD, whereas the ED group was associated with SAD, but not with the size of main and intermedius bronchus. These findings confirm the notion that small airway disease is a feature of the emphysema-dominant COPD [10, 13–15] and suggest for the first time that a smaller central airway size, but not small airway disease, is a feature of the CT-based AD COPD subtype.
A previous CT study by Park et al. [35] visually diagnosed subjects with wall thickening of the central airways without emphysema with “bronchial disease” and showed that the extent of small airway disease was milder in this bronchial disease subtype than in the moderate to severe CLE subtype. The present data confirm and expand upon those findings by providing quantitative CT measurements of central airway dimensions to show that the SAD% was lower in the AD group than in the ED group.
Moreover, the lumen area of the segmental airway was decreased in the AD group compared to that in the mixed and ED groups, whereas the wall area did not differ between the groups. Furthermore, the lumen size of the right main and intermedius bronchus was smaller in the AD group than in the mild group, but the lung size did not differ between the two groups. These findings suggest that a small central airway tree for a given lung size, in other words dysanapsis [22], may be a major feature of the AD subtype.
The Kyoto–Himeji cohort showed that a prior history of asthma before age of 40 years was more frequent in the AD group than in the other three groups. Additionally, the analysis of the Hokkaido COPD cohort, although that study did not include patients with a prior history of asthma, showed that asthma-like features such as a blood eosinophil count ≥300 μL−1 and atopy [26] were more frequent in the AD group than in the other groups. Diaz et al. [36] showed that a smaller central airway size contributes to greater airflow limitation, even in never-smokers, and childhood-onset asthma is closely associated with a smaller central airway size in adult smokers [37]. These results suggest that the smaller airways in the AD subtype might be induced by a combination of native airway size and airway damage in childhood, such as from asthma, but a distinct response to cigarette smoke exposure in the airways and parenchyma in adulthood might also affect airway size.
The SAD% was greater in the ED and mixed groups compared to the mild and AD groups. On visual assessment, CLE findings (pure CLE or CLE+PSE) were identified in >80% of the ED and mixed groups. These results suggest the notion that small airway disease is closely associated with the CLE-dominant COPD subtype [10, 13–15]. In contrast, the SAD% was lower in the AD group than in the ED group, and pure PSE was found in 22% and 3% of patients in the AD and ED groups, respectively. This supports the hypothesis that small airway disease is less involved in the pathogenesis of PSE than in that of CLE [23, 35].
More patients in the ED and mixed groups used long-acting muscarinic antagonist (LAMA) than in the mild and AD groups (table 2). Since LAMA increases lumen areas of central airways [38], we performed additional sub-analysis of patients treated with LAMA and found that the main findings from all the patients (table 3) were reproduced (supplementary table S1). This suggests that the influence of different rates of LAMA use on the present results is small.
In the Hokkaido COPD cohort, the annual decline in FEV1 over 5 years was smaller in the AD group than in the ED and mixed groups. This is consistent with previous reports on the association of emphysema with a rapid decline in FEV1 in COPD patients [24, 33]. Furthermore, the present data build upon the works from Smith et al. [22], who showed that COPD patients with dysanapsis were not associated with a rapid FEV1 decline, and Hayden et al. [39], who showed that a history of asthma before COPD onset was associated with exacerbations but not with a rapid lung function decline in COPD.
Based on these findings, we propose the CT-based AD COPD subtype as a distinct entity that is morphologically characterised by a smaller central airway tree with less small airway disease and is clinically characterised by an elevated BMI, more frequent asthma history and/or asthma-like features, and slower lung function decline. Therefore, identifying the AD group using CT is clinically relevant to providing personalised management of the disease. Since ∼50% of COPD patients have a reduced maximal lung function in younger age and a higher incidence of COPD despite a normal decline in FEV1 [40], the present data raise the hypothesis that smaller airway trees may exist before COPD onset, increase COPD incidence and can be a main driver for the development of the AD subtype even without an accelerated decline in lung function.
Several limitations need to be mentioned. First, the sample size of the two cohorts was relatively small. Since the original purpose of this study was not to characterise the AD group, the present analyses included less patients in the AD groups than in the ED group. While the main finding that the SAD% was lower in the AD group than in the ED group was successfully reproduced in the independent Hokkaido COPD cohort, a future cohort which would equally include patients in the AD and ED groups should be performed to verify the present findings. Second, this study did not include healthy nonsmokers. We did not determine the specific cut-off values of LAV% and WA% for the present study to identify the AD and ED subtypes. Alternatively, we used an LAV% of 10% and WA% of 60% as the cut-offs based on previous papers [32–34]. Third, spirometric gating was not used during the CT scans. Alternatively, all the patients were carefully coached to hold the breath at full inspiration and end-tidal expiration. Fourth, the proportion of males was over 90%. The generalizability of the present findings to female patients is unclear.
In conclusion, by using two independent cohorts, the present data suggest that the airway disease-dominant COPD, defined using central airway dimension on CT, is associated with a smaller central airway tree, but not with the small airway disease, unlike the ED COPD. The use of CT-based categorisation into the AD and ED subtypes to reflect distinct natural COPD histories may help establish personalised medicine approaches to managing the heterogeneous manifestations of this disease.
Supplementary material
Supplementary Material
Please note: supplementary material is not edited by the Editorial Office, and is uploaded as it has been supplied by the author.
Supplementary material 00672-2020.SUPPLEMENT
Acknowledgements
The authors would like to thank Atsuyasu Sato, Kazuya Tanimura, Yoko Hamakawa, Tatsushi Mizutani, Yusuke Shiraishi and Yi Zhang for collecting the data of the Kyoto-Himeji cohort. The authors would also like to thank the Hokkaido COPD Cohort Study investigators for patient recruitment and follow-up, as well as Hironi Makita, Hideka Ashikaga, Ayako Kondo and Yuko Takagi of the Central Office of the Hokkaido COPD Cohort Study (Sapporo, Japan) and the staff of Exam Co., Ltd (Sapporo, Japan) for data management.
Footnotes
This article has supplementary material available from openres.ersjournals.com.
Author contributions: N. Tanabe, K. Shimizu, K. Terada, S. Sato and M. Suzuki made contributions to the design of the study, and the analysis and interpretation of data. H. Shima and A. Oguma made substantial contributions to the CT data analyses. T. Oguma created software to analyse the airway structure, and contributed to the analysis and interpretation of the data. S. Konno, M. Nishimura and T. Hirai made contributions to the design of the study and critically revised the manuscript for important intellectual content.
Conflict of interest: N. Tanabe reports grants from FUJIFILM during the conduct of the study; and personal fees from AstraZeneca, Nippon Boehringer Ingelheim and GlaxoSmithKline outside the submitted work.
Conflict of interest: K. Shimizu has nothing to disclose.
Conflict of interest: K. Terada has nothing to disclose.
Conflict of interest: S. Sato has nothing to disclose.
Conflict of interest: M. Suzuki reports grants and lecture fees from AstraZeneca and Novartis, and lecture fees from Boehringer Ingelheim and GlaxoSmithKline, outside the submitted work.
Conflict of interest: H. Shima has nothing to disclose.
Conflict of interest: A. Oguma has nothing to disclose.
Conflict of interest: T. Oguma reports joint research with FUJIFILM during the conduct of the study, and lecture fees from AstraZeneca, Boehringer Ingelheim and GlaxoSmithKline outside the submitted work.
Conflict of interest: S. Konno reports grants from AstraZeneca, Novartis, Boehringer Ingelheim and Kyorin outside the submitted work.
Conflict of interest: M. Nishimura reports grants from Nippon Boehringer Ingelheim and Pfizer Japan during the conduct of the study.
Conflict of interest: T. Hirai reports grants from FUJIFILM during the conduct of the study.
Support statement: The Kyoto-Himeji cohort was partially supported by a grant from the Fujifilm corporation and the Japan Society for the Promotion of Science (JSPS) (Grants-in-Aid for scientific research 19K08624). The Hokkaido COPD Cohort Study is supported by a scientific research grant to the Hokkaido COPD Cohort Study from the Ministry of Education, Science, Culture and Sports of Japan (17390239 and 2139053 to MN), Nippon Boehringer Ingelheim, Pfizer, Inc., and a grant to the Respiratory Failure Research Group from the Ministry of Health, Labour, and Welfare, Japan. Funding information for this article has been deposited with the Crossref Funder Registry.
- Received September 15, 2020.
- Accepted December 21, 2020.
- Copyright ©The authors 2021
This version is distributed under the terms of the Creative Commons Attribution Non-Commercial Licence 4.0. For commercial reproduction rights and permissions contact permissions{at}ersnet.org
References


