


Figures
- FIGURE 1
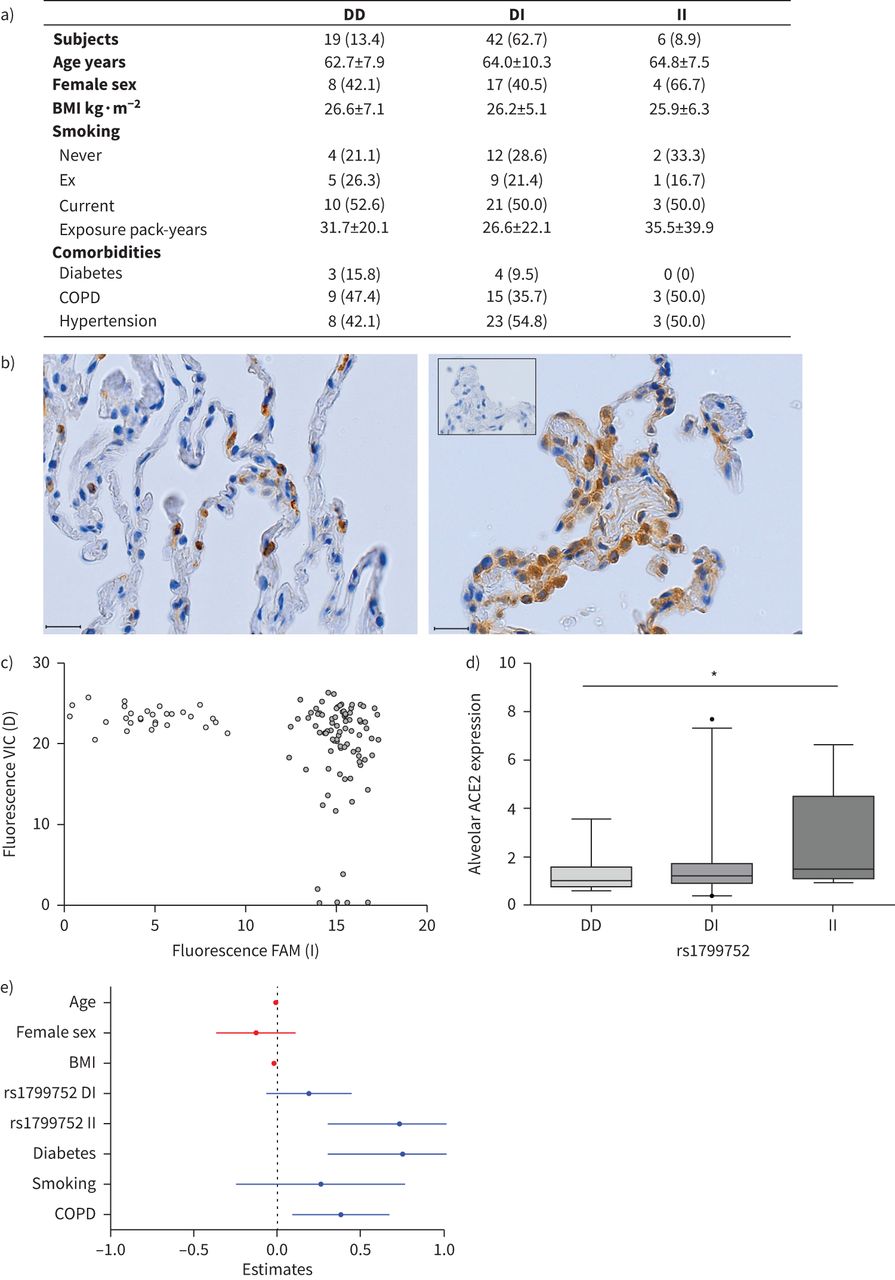
Angiotensin-converting enzyme 2 (ACE2) protein levels in alveolar lung epithelium according to allele of rs1799752. a) Patient characteristics grouped according to the three genotypes (DD, DI, II) of the deletion/insertion (D/I) polymorphism. No significant differences between groups were found using Mann–Whitney U-test for continuous outcomes or Fisher's exact test for binomial outcomes. Data are presented as n (%) or mean±sd. b) Representative images of a ACE2 low (left) and mid-to-high range (right) score immunohistochemistry staining, showing positive signal in alveolar tissue, at a 400× magnification. The small inlay is representative of the negative isotype control staining. Scale bars=20 μm. c) Graph depicting mean values of PCR fluorescent signal of 2 replicates per sample in the VIC (533–580 nm, assay C_60538594B_20) and FAM (465–510 nm, assay C__60538594A_10) channels. d) Bar plot depicting median values of ACE2 expression in alveolar epithelium, normalised for the total alveolar tissue of subjects with DD (n=19), DI (n=42), and II (n=6) ACE1 genetic variants. Error bars represent 2.5th–97.5th percentiles. *: p<0.05 according to the unpaired t-test on the natural logarithm transformed ACE2 expression values. e) Forest plots depicting regression coefficients from linear regression analyses with determinant median ln values of ACE2 expression (n=67) and adjusted for age, female sex, BMI, DI (compared with DD), II (compared with DD), diabetes, smoking (compared with never-smoking without COPD), and COPD (compared with never-smoking without COPD). p-values for regression for age, female sex, BMI, DI, II, diabetes, smoking and COPD are 0.030, 0.296, 0.035, 0.149, 0.002, 0.002, 0.089 and 0.011, respectively. BMI: body mass index.


