


Figures
- FIGURE 1
Study CONSORT diagram. GB: glycopyrronium; FF: formoterol fumarate; FP: fluticasone propionate; FDC: fixed-dose combination; FAS: full analysis set; PPS: per-protocol set; SAF: safety analysis population.
- FIGURE 2
Plot of least-square means (LSM)±se of change from baseline of trough forced expiratory volume in 1 s (FEV1) with mixed-effect model repeated measure (MMRM) full analysis set. R: 50 μg glycopyrronium (GB) once dailly + fixed-dose combination (FDC) 12 μg formoterol fumarate (FF)/250 μg fluticasone propionate (FP) twice daily; T: FDC 12.5 μg GB/12 μg FF/250 μg FP twice daily. p-values of NI for T versus R at weeks 2, 4, 8, and 12 were <0.05, <0.05, 0.08 and <0.05, respectively. p-values of SP for T versus R at weeks 2, 4, 8, and 12 were 0.10, 0.09, 0.07 and 0.13, respectively. p-values of change from baseline for T at weeks 2, 4, 8, and 12 were <0.001, 0.003, 0.008 and <0.001, respectively. p-values of change from baseline for R at weeks 2, 4, 8, and 12 were <0.001, <0.001, <0.001 and <0.001, respectively. LSM of change from baseline of trough FEV1 (L) was calculated with MMRM method with treatment, centre, visit, and treatment-by-visit interaction as fixed-effect factors and lung function FEV1 (L) at baseline as covariate. NI: noninferiority; SP: superiority.
- FIGURE 3
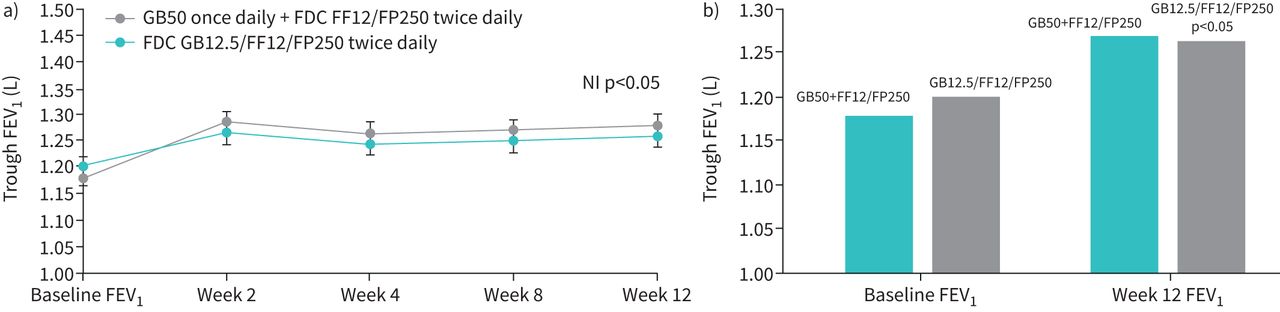
Lung function trough forced expiratory volume in 1 s (FEV1) by visits in full analysis set population: a) at baseline, weeks 2, 4, 8, and 12; b) at baseline and week 12. GB: glycopyrronium; FF: formoterol fumarate; FP: fluticasone propionate; FDC: fixed-dose combination; NI: noninferiority.


Tables
- TABLE 1
Summary of demographic and other baseline characteristics
GB50 once daily+FDC FF12/FP250 twice daily FDC GB12.5/FF12/FP250 twice daily Subjects n 190 197 Age (years) 60±8.4 62.1±7.7 Sex Female 9 (4.7) 10 (5.1) Male 181 (95.3) 187 (94.9) Race Asian 190 (100) 197 (100) Weight (kg) 57.75±11.5 56.52±12 Height (cm) 163.41±6.8 162.25±7.3 Severity Mild COPD: FEV1 post-bronchodilator ≥80% predicted 1 (0.5) 0 Moderate COPD: FEV1 post-bronchodilator <80% and ≥50% predicted 81 (42.6) 94 (47.7) Severe COPD: FEV1 post-bronchodilator <50% and ≥30% predicted 108 (56.8) 103 (52.3) FEV1 reversibility (mL) 102.2±141.7 103.1±131 FEV1 reversibility (%) 12.1±20.6 10.9±14.3 % predicted FEV1 48.2±12.3 48.6±11.8 Smoking (pack-years) 20.454±11.4 21.087±12.7 Data are presented as mean±sd or n (%), unless otherwise stated. FDC: fixed-dose combination; FEV1: forced expiratory volume in 1 s; FF12: 12 μg formoterol fumarate; FP250: 250 μg fluticasone propionate; GB12.5: 12.5 μg glycopyrronium; GB50: 50 μg glycopyrronium.
- TABLE 2
Summary of subjects with treatment-emergent adverse events (TEAEs) (safety population)
GB50 once daily+FDC FF12/FP250 twice daily FDC GB12.5/FF12/FP250 twice daily Total Subjects n 197 198 395 TEAE 49 (24.9) 50 (25.3) 99 (25.1) SAE 1 (0.5) 3 (1.5) 4 (1.0) AE leading to death 1 (0.5) 0 1 (0.3) AE leading to permanent discontinuation of IP 5 (2.5) 5 (2.5) 10 (2.5) AE leading to early termination 5 (2.5) 5 (2.5) 10 (2.5) AE by relationship Yes 12 (6.1) 20 (10.1) 32 (8.1) No 37 (18.8) 30 (15.2) 67 (17.0) SAE by relationship Yes 0 1 (0.5) 1 (0.3) No 1 (0.5) 2 (1.0) 3 (0.8) AE by severity Mild 38 (19.3) 37 (18.7) 75 (19.0) Moderate 10 (5.1) 10 (5.1) 20 (5.1) Severe 1 (0.5) 3 (1.5) 4 (1.0) Data are presented as n (%), unless otherwise stated. Percentages are based on the number of subjects in the safety population in the respective treatment groups. Study drug-related AE is defined as an AE with a relationship considered and reported as “Related” by the investigator. Subjects with more than one AE were counted only once. AE: adverse event; FDC: fixed-dose combination; FF12: 12 μg formoterol fumarate; FP250: 250 μg fluticasone propionate; GB12.5: 12.5 μg glycopyrronium; GB50: 50 μg glycopyrronium; IP: investigational product; SAE: serious adverse event.
Supplementary Material
Please note: supplementary material is not edited by the Editorial Office, and is uploaded as it has been supplied by the author.
Supplementary material 00255-2021.supplement


