


Abstract
Introduction Evidence suggests that abnormalities occur in the lung microvasculature in idiopathic pulmonary fibrosis (IPF). We hypothesised that dynamic contrast-enhanced (DCE)-magnetic resonance imaging (MRI) could detect alterations in permeability, perfusion and extracellular extravascular volume in IPF, thus providing in vivo regional functional information not otherwise available.
Methods Healthy controls and IPF subjects underwent DCE-MRI of the thorax using a dynamic volumetric radial sampling sequence and administration of gadoterate meglumine at a dose of 0.1 mmol·kg−1 at 2 mL·s−1. Model-free analysis of signal intensity versus time curves in regions of interest from a lower, middle and upper axial plane, a posterior coronal plane and the whole lung yielded parameters reflective of perfusion and permeability (peak enhancement and rate of contrast arrival (kwashin)) and the extracellular extravascular space (rate of contrast clearance (kwashout)). These imaging parameters were compared between IPF and healthy control subjects, and between fast/slow IPF progressors.
Results IPF subjects (n=16, 56% male, age (range) 67.5 (60–79) years) had significantly reduced peak enhancement and slower kwashin in all measured lung regions compared to the healthy volunteers (n=17, 65% male, age (range) 58 (51–63) years) on unadjusted analyses consistent with microvascular alterations. kwashout, as a measure of the extravascular extracellular space, was significantly slower in the lower lung and posterior coronal regions in the IPF subjects consistent with an increased extravascular extracellular space. All estimates were attenuated after adjusting for age. Similar trends were observed, but only the associations with kwashin in certain lung regions remained statistically significant. Among IPF subjects, kwashout rates nearly perfectly discriminated between those with rapidly progressive disease versus those with stable/slowly progressive disease.
Conclusions DCE-MRI detects changes in the microvasculature and extravascular extracellular space in IPF, thus providing in vivo regional functional information.
Abstract
Dynamic contrast-enhanced MRI demonstrates important in vivo lung regional microvascular and extravascular extracellular differences between IPF patients and healthy controls. These results signify IPF pathobiology and may have prognostic significance. https://bit.ly/3l14SWM
Background
Several lines of evidence suggest that idiopathic pulmonary fibrosis (IPF) is associated with abnormalities in the pulmonary circulation resulting in increased vascular permeability [1]. IPF patients have increased protein in their bronchoalveolar lavage (BAL), consistent with increased capillary leakage, with protein highest in IPF patients who died within 3 years of follow-up [2]. Faster clearance rates of inhaled technetium-99m-labelled diethylenetriaminepentaacetate, as a marker of increased alveolar–capillary permeability, is associated with worse survival in IPF [3]. Measurement of vessel-related structures on computed tomography (CT) predicted outcomes in IPF, suggesting that pulmonary vasculature measurements confer prognostic information [4].
We hypothesised that dynamic contrast-enhanced (DCE) magnetic resonance imaging (MRI) could detect microvascular changes in IPF. DCE-MRI is a powerful technique whereby continuous, sequential imaging is performed before, during and after the injection of an intravenous contrast agent. A signal intensity over time curve is generated providing information about contrast kinetics within a tissue of interest. From this information, changes in the microvasculature and the extravascular extracellular space can be quantified [5]. DCE-MRI is widely performed in brain and breast tumour imaging [6, 7] and is starting to be applied to pulmonary conditions [8–11]. Lung MRI has historically been challenging due to motion sensitivity and low signal, but recent MRI advances (radial sampling, sparse sampling, improved reconstruction techniques) enable fast three-dimensional (3D) lung imaging without requiring breath holding or complex registration [9, 12–14].
Here, we perform free-breathing DCE-MRI to measure changes in the pulmonary microvasculature and the extravascular extracellular space in IPF compared to healthy controls and explore whether such measures associate with outcomes in IPF.
Methods
Study subjects and subject screening
This study was approved by the Partners institutional review board. All subjects provided written consent. IPF patients seen at Massachusetts General Hospital (Boston, MA, USA) were recruited. A diagnosis of IPF was confirmed based on clinical records including CT and, if available, histopathology in accordance with established guidelines. Healthy controls were recruited via the Partners Healthcare System Research Study Volunteer Program, without known lung disease, and within 50–80 years of age. Subjects were excluded for active cardiac disease, including congestive heart failure; pneumonia or other respiratory illnesses within 6 weeks of enrolment; tobacco use within 6 months; pregnancy; or contraindications to MRI or receiving gadolinium-based contrast agents.
DCE-MRI acquisition
MRI was performed using 3-Tesla MRI scanners (Siemens Healthineers, Erlangen, Germany). The volumetric stack-of-stars radial sampling sequence (dynStarVIBE) [15–18] was used to acquire serial DCE images during free breathing with the following parameters: 12° flip angle, 1.0 ms echo time, 3.4 ms repetition time, 40 K radial spokes rotated at a golden-angle ordering, field of view of 400×400×400 mm and an isotropic spatial resolution of 1.56 mm. The DCE acquisition started up to 60 s before i.v. administration of the contrast agent and continued for up to 300 s. The average interval between dynamic acquisitions was 4.2±1.8 s. A bolus of 0.1 mmol·kg−1 (0.2 mL·kg−1) of gadoterate meglumine (Guerbet), a macrocyclic gadolinium-based MRI extracellular fluid contrast agent, at a clinical standard dose of 0.1 mmol·kg−1 (0.2 mL·kg−1) was injected at a rate of 2 mL·s−1 i.v. using a power injector, with the aim of being adequately safe and providing sufficient contrast enhancement for vascular space as well as interstitial space.
Image analyses
Four regions of interest (ROIs) were drawn on axial slices at pre-defined upper (level of aortic arch), middle (level of the bifurcation of the pulmonary artery trunk) and lower (prior to appearance of diaphragm) regions of the lung and on a coronal slice posterior to the heart and across the descending aorta using OsiriX MD (Pixmeo). An additional 3D whole-lung ROI was defined over the lung parenchyma across all imaging slices. The heart, pulmonary artery, descending aorta and large hilar vessels were excluded from regional or whole-lung analyses. Images were analysed using custom-written programmes in MATLAB (MathWorks). The dynamic acquisitions were first interpolated temporally with a cubic smoothing spline function on a pixel basis to achieve the same temporal resolution of 0.5 s per volume. The dynamic curves were calculated as the percentage signal intensity change over baseline where baseline signal intensity was calculated by averaging the dynamic acquisitions before the bolus of contrast arrived in the pulmonary artery (10% signal enhancement in the pulmonary artery). A model-free analysis was performed. Parameters of interest were extracted from the averaged dynamic curves of each ROI, including peak enhancement during the first passage (PE); time to peak (TTP); mean gradient of the first passage peak (kwashin), calculated as kwashin=PE/TTP; area under the dynamic curve in the first 60 s after bolus arrival (AUC60), calculated by using the trapezoidal rule; and late-phase washout slope (kwashout), calculated by linear fitting of the points between 60-s post-injection and the last acquisition.
Pulmonary function testing
Results of pulmonary function tests (PFTs), including forced vital capacity (FVC) and diffusing capacity of the lung for carbon monoxide corrected for haemoglobin were obtained from medical record review for the IPF subjects only. Results of PFTs performed closest to the date of MRI were recorded as baseline. Subsequent PFTs were recorded over a 1-year follow-up period (±4 months). PFTs deemed by a pulmonologist not to meet established criteria for interpretation [19] or within 6 weeks of a respiratory infection were excluded.
Determination of outcomes
The change in FVC from baseline to the end of the follow-up period was used to classify IPF subjects’ disease into stable/slow progression (decline in FVC <10%) or rapid progression (decline in FVC ≥10% or death from respiratory failure). Mortality was recorded at 1 year. If multiple FVC measurements were taken post-baseline, the measurement closest to 1 year±4 months was used for analyses.
Statistics
Categorical variables were summarised using frequencies and percentages. Continuous variables were summarised as median (interquartile range), mean±sd as appropriate, unless otherwise specified. The Pearson Chi-squared test and the Wilcoxon rank sum test were used to assess distributional differences in categorical and continuous variables, respectively. Separate linear regression models were estimated to quantify the association between each imaging metric and group (IPF and healthy controls) with and without the adjustment for age. Estimates of model parameters, and their 95% confidence intervals, were estimated to summarise expected group differences (IPF − healthy controls). Exploratory analyses were performed to determine whether distributions of MRI-derived measures differed by IPF subgroup (stable/slow versus rapid). A Type-I error of 5% is assumed for all hypothesis tests and confidence intervals. All analyses were performed using R 3.4.3 (www.R-project.org/) and Prism 6 (GraphPad Software, La Jolla, CA, USA).
Results
Subject characteristics
DCE-MRI was performed on 16 subjects with IPF and 19 healthy controls. Of the 19 healthy controls, the results from two subjects were excluded: one due to technical difficulties and one because the subject was found later to have been an active smoker. Demographic and clinical data are summarised in table 1. Healthy controls and IPF subjects differed by age (healthy controls median (range) 58 (51–63) years versus IPF 67.5 (60–79) years, p≤0.001) and smoking status (ever-smoker: healthy controls 0% versus IPF 56%, p<0.001). Baseline PFTs were available on 15 IPF subjects and performed 55 (12.5–89.5) days prior to MRI, except for two IPF subjects who underwent PFTs within 2 weeks after MRI. One subject had PFTs >6 months prior to MRI, and thus PFTs were not included. The majority of IPF subjects (n=13) were taking pirfenidone or nintedanib. Follow-up PFTs were available on the 15 IPF subjects with baseline spirometry. Three IPF subjects died from respiratory failure. For the remaining 12 subjects, median duration from MRI to follow-up PFTs was 376 (306–431.5) days. Of the 15 IPF subjects who had baseline PFTs, 10 had stable/slow disease progression and five had rapid disease progression. Differences in the distributions of age and baseline percentage predicted FVC between groups were not detected (table 2).
Descriptive statistics by healthy control and idiopathic pulmonary fibrosis (IPF) subject groups
Descriptive statistics by stable/slow idiopathic pulmonary fibrosis (IPF) progressor and rapid IPF progressor groups
Model-free analysis of DCE-MRI
Figure 1 shows the group-averaged dynamic curves of the posterior coronal lung ROIs from healthy controls (n=17) and IPF subjects (n=16). For both curves, we observed a first-pass peak for the pulmonary arterial phase, a smaller second-recirculation peak for the pulmonary venous phase, and a steady washout slope during the late redistribution phase. Although the first-pass peaks were reached at approximately the same time, the IPF group had a smaller first-pass peak than the healthy control group (IPF 250±90% versus healthy controls 320±80%) and a slower late-phase washout rate, kwashout (IPF −12±11%·min−1 versus healthy controls −20±9%·min−1).
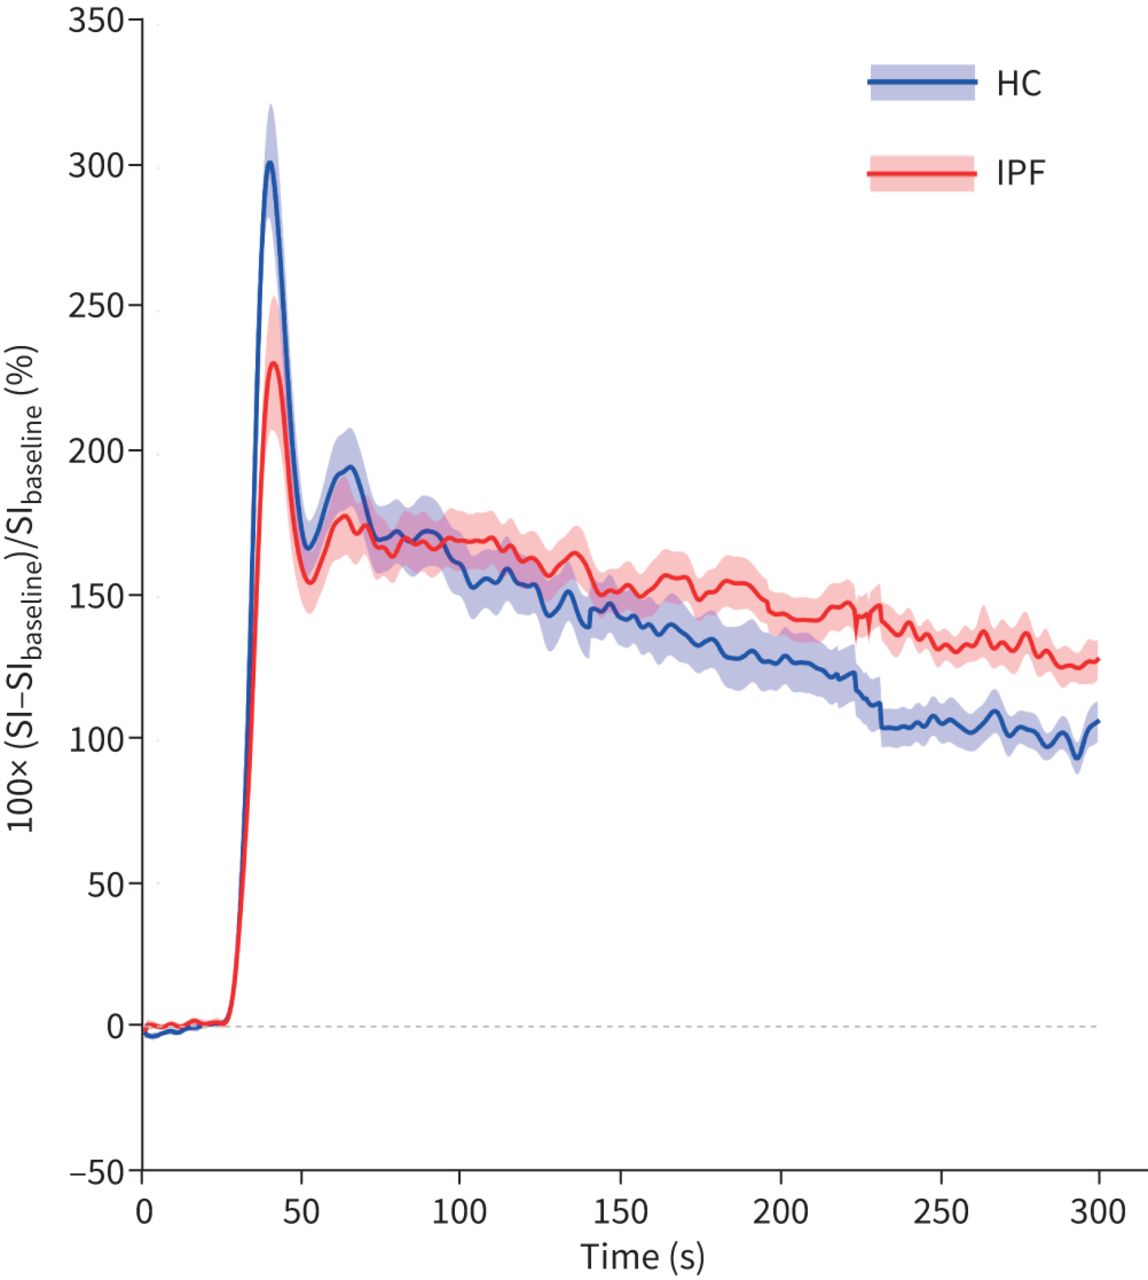
Dynamic curves of the lung parenchyma from healthy controls (HC; n=17) and idiopathic pulmonary fibrosis (IPF) subjects (n=16) computed as percentage signal intensity (SI) change relative to baseline over time. The group-averaged the dynamic curves from posterior coronal regions of interest are shown. Shaded area indicates mean±1 sem.
Figure 2 shows the quantitative parameters from different lung regions in healthy controls and IPF subjects. Table 3 summarises the DCE-MRI measurements and results from the linear regression models (e.g. differences in expected values between IPF and healthy controls groups; IPF − healthy controls). Based on the unadjusted analysis, IPF subjects tended to have lower PE values (e.g. whole lung −65% (−110– −21%), p=0.007), a longer TTP in the posterior coronal region (0.027 (0.001–0.052) min, p=0.047), slower wash-in rates (e.g. lower axial −500%·min−1 (−740– −270%·min−1), p<0.001) and slower clearance rates in the lower axial and posterior coronal regions (e.g. lower axial kwashout 9.5%·min−1 (2.1–16.8%·min−1), p=0.017). Differences in the AUC60 values were not detected between the groups. All estimates were attenuated after adjusting for age. Similar trends were observed, but only the associations with kwashin in certain lung regions (lower axial, posterior coronal and whole lung) remained statistically significant.

Comparison of model-free dynamic contrast-enhanced magnetic resonance imaging parameters between the healthy control (HC) group and the idiopathic pulmonary fibrosis (IPF) group. The parameters were derived from the dynamic curves measured from four regions of interest in the lung parenchyma, including upper, middle and lower regions of the lung defined on axial slices as well as on a coronal slice posterior to the heart and across the descending aorta in addition to the whole lung. Results displayed as boxplots with solid line denoting median, box denoting 25–75th percentiles and whiskers denoting minimum to maximum values. Unadjusted p-values obtained from univariable linear regression models are shown. *: p<0.05, **: p<0.01, ***: p<0.001. PE: peak enhancement; TTP: time to peak; kwashin: rate of contrast arrival; kwashout: rate of contrast clearance; AUC60: area under the dynamic curve in the first 60 s.
Differences in dynamic contrast-enhanced parameters between idiopathic pulmonary fibrosis and healthy control groups
Association of MRI-derived metrics with IPF subgroup (stable/slow progression versus rapid progression)
Figure 3a shows the averaged DCE curves from the ROIs over the pulmonary artery and posterior coronal lung parenchyma from a representative healthy control and subjects from each IPF subgroup: stable/slow disease progression and rapid progression. The normal lung dynamic curve has a sharp and narrow first-pass peak and a rapid washout at late phase. In contrast, the first-pass peak is absent in the curve of the IPF subject with stable/slow disease progression. Signal enhancement remained elevated during the late phase, indicating slow elimination of contrast agent in the lung parenchyma. The curve from the IPF subject with rapid progression started at an even smaller signal enhancement without a first-pass peak, and signal enhancement increased steadily over the late phase, reflecting accumulation of contrast agent. Figure 3b–d shows the representative parametric maps of PE, kwashin and kwashout from the same healthy control and IPF subjects. The parametric maps for both IPF subjects show marked heterogeneity, while they are homogeneous with relatively higher PE, faster kwashin and kwashout throughout the lung for the healthy subject. The differences in PE, kwashin and kwashout are more pronounced visually in the IPF subject with rapidly progressive disease. When compared to the most recent high-resolution CT performed for clinical indications (figure 3e), areas of reduced PE and delayed kwashin and kwashout occur both in areas of CT-apparent fibrosis and areas appearing “normal”.
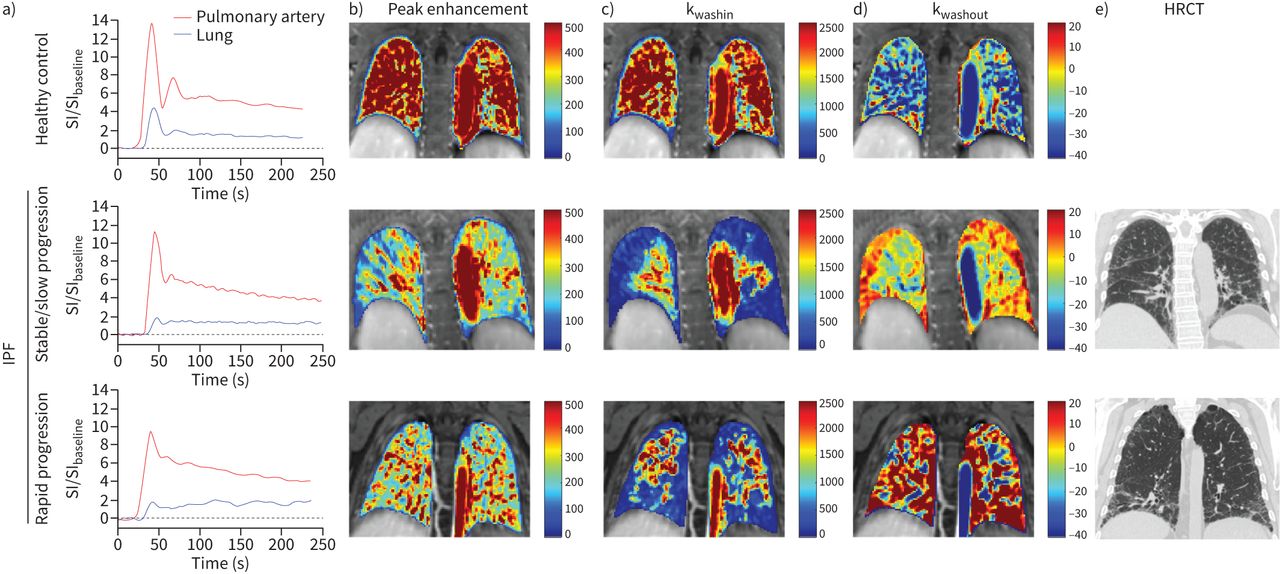
Representative a) dynamic curves and parametric maps of b) peak enhancement, c) rate of contrast arrival (kwashin), and d) rate of contrast clearance (kwashout) from a healthy control subject, an idiopathic pulmonary fibrosis (IPF) patient with stable/slow disease progression and an IPF patient with rapid disease progression. e) For each IPF patient, a coronal slice from high-resolution computed tomography (HRCT) obtained within 6 months prior to magnetic resonance imaging is shown. When compared to b, c, and d, abnormalities in peak enhancement, kwashin and kwashout are not limited to areas of fibrosis detected upon HRCT. SI: signal intensity.
Among IPF subjects (NIPF=15, nstable/slow=10, nrapid=5), distributions of kwashout between groups differed in all lung regions (supplementary table S1). In fact, kwashout nearly perfectly discriminated between stable/slow and rapid IPF progression (figure 4). For example, the ranges of kwashout in the lower lung region did not overlap (slow/stable −33– −0.94%·min−1, rapid 0.28–17%·min−1; p<0.001. Differences were detected between IPF groups in PE, kwashin and AUC60 in several lung regions including the lower axial region (supplementary table S1). Based on these preliminary data, kwashout, as well as PE, kwashin and AUC60 may be promising variables for use in prognostic models.

Comparison of rate of contrast clearance (kwashout) between idiopathic pulmonary fibrosis patient subgroups: stable/slow progression (n=10) versus rapid progression (n=5). Results displayed as boxplots with solid line denoting median, box denoting 25–75th percentiles and whiskers denoting minimum to maximum values. p-values obtained from Wilcoxon rank sum test are shown. *: p<0.05, **: p<0.01, ***: p<0.001.
Discussion
We applied DCE-MRI to quantify differences in tissue kinetic characteristics between IPF subjects and healthy controls, thus providing important information about IPF pathobiology not otherwise available. There is evidence that the lung microvasculature is abnormal in pulmonary fibrosis [20–22]. We were able to quantify in vivo global and regional changes in the lung microvasculature in IPF using DCE-MRI. Our study had two main findings. First, IPF patients had differences in lung microvascular measures compared to healthy volunteers even after adjusting for age. Second, the rate of contrast washout discriminated between IPF subjects who had rapid disease progression versus those who did not; however, this later finding needs to be confirmed in a larger study.
When compared to healthy controls, IPF subjects had reduced peak enhancement and kwashin, parameters reflective of the microvasculature, in all measured lung regions on unadjusted analyses, and only reductions in kwashin in the whole lung, lower axial and posterior coronal regions remained statistically significant when adjusting for age. A reduced first-pass peak, denoting a reduction in peak enhancement and a slower contrast wash-in rate, has been demonstrated in other pulmonary conditions such as COPD and asthma and was rationalised as decreased tissue perfusion and/or contrast agent extravasation from increased vascular permeability [8, 23]. It was recently demonstrated by Weatherley et al. [11] that contrast bolus lung transit time increased over time in IPF consistent with worsening perfusion. We showed previously that albumin extravasation is increased throughout the entire lung in pulmonary fibrosis consistent with diffuse microvascular abnormalities [24]. Our findings build on these prior data by informing as to the regional differences in microvascular changes and suggest that lung microvasculature abnormalities are important to underlying IPF pathobiology and may pre-date the occurrence of tissue fibrosis [25]. Interestingly, the whole-lung unadjusted analyses showed a reduced peak enhancement, slower wash-in and washout rates in IPF, which may be attributed to noise reduction by signal averaging. In addition, the coefficient of variance (CoV) measured from the whole lung is reported for each DCE-MRI parameter in supplementary table S2. The CoV could potentially serve as a measure of intrasubject disease heterogeneity, which requires further investigation in the future.
Notably, we detected an age effect in our measurements. When we adjusted for age, only differences in kwashin in the whole lung, lower lung and posterior coronal regions remained statistically significant between groups. As our sample size was small, it is unclear how strong an effect age may have had on our findings, and this should be evaluated further. However, our results do suggest that changes in the lung microvasculature may occur with increasing age, as occurs with multiple diseases in other organ systems, and the lack of study in the vascular effects of lung ageing is an important area of omission in the current literature that needs further study. As only differences between groups in kwashin remained significant when adjusting for age, the microvascular differences we detected may be driven primarily by alternations in perfusion occurring in IPF.
In our exploratory analyses, kwashout was associated with IPF progression in all measured lung regions. kwashout in the lower lung region distinguished between IPF subjects who subsequently displayed rapid disease progression and those who did not despite similar FVC % predicted at baseline. kwashout values were significantly different between stable/slow and rapid IPF progressors in all regions of the lung measured and the difference was largest in the lower lung region. A delayed washout of contrast indicates accumulation of gadolinium, an extracellular contrast agent, into an increased extravascular extracellular volume. While this could be caused by inflammation or oedema, the replacement of cellular components with matrix in fibrotic lungs results in extracellular volume expansion. A similar MRI finding, late gadolinium enhancement, is used to detect myocardial fibrosis [26]. In rapid progressors, lung signal continued to rise (positive slope) over the measurement period, indicating that the contrast agent had not yet reached equilibrium between the extra- and intravascular space, reflecting an increased extravascular extracellular volume. For those with stable/slowly progressive disease the signal decreased with time. Increased CT attenuation arises from fibrosis, but also increased cellularity and/or oedema, while kwashout may provide a true tissue functional measurement. We hypothesise that the large extravascular extracellular volume in the rapid progressors reflects greater fibrosis where the normal cell volume has been replaced by matrix. Our results should be considered exploratory due to our small sample size, variations in follow-up times for PFTs and differences in treatments between groups.
The pathophysiological interpretation of the reduced peak enhancement, kwashin and the slower contrast washout rate in IPF may be further elucidated in future studies by exploring the relationships between model-free DCE-MRI parameters and parameters derived from a model, e.g. Tofts, to better delineate perfusion versus permeability effects. We chose a model-free approach for several reasons. First, model-based analysis of DCE-MRI data requires knowledge of the arterial plasma concentration of the contrast agent. While this arterial input function (AIF) can be estimated from the blood MRI signal, it can introduce additional uncertainty which contaminates the final measurements of tissue physiology if low temporal resolution or if the inflow effect is not fully suppressed. Second, the choice of AIF depends on the tissue being studied. For the lung, a dual input function that accounts for contributions from the pulmonary and bronchial circulation is desirable. Given the spatial resolution, it may not be possible to derive a bronchial input function. However, the time scale of the delay in washout is much longer than any potential differences in input functions between arterial supplies. Therefore, the washout rate will probably not be affected by the analysis method. Third, nonlinearity between the arterial gadolinium concentration and measured MRI signal is of concern at the standard gadolinium dose used in the current study. In future studies, using half standard dose or lower will allow the AIF to be derived from the pulmonary artery for reliable kinetic modelling and to assess the perfusion phase of the tissue signal. Alternatively, the nonlinearity problem could be solved by calculating these kinetic parameters from the contrast agent concentration curves, which could be determined by measuring the baseline T1 and the dynamic T1 change.
Prior groups have used contrast-enhanced MRI to assess tissue changes in IPF [27–29]. Lavelle et al. [27] demonstrated that compared to control subjects, IPF patients had late-enhancement of contrast with signal intensity correlating to the degree of fibrosis on CT. Yi et al. [28] noted a trend towards delayed contrast enhancement in areas of fibrosis-predominant versus inflammation-predominant lung tissue determined by histology. Our results build on and expand these findings. The sequence used here incorporates many advances in image acquisition and reconstruction: radial imaging at optimal sparsity, rapid reconstruction and binning and sharing lines of k-space to create a freezing effect on motion [9, 30, 31]. This enables fast 3D imaging of the entire lung during free breathing that allows for pixelwise analysis of dynamic parameters without the need for complex registration. The DCE-MRI performed here was robust, and the data analysis straightforward, which present a low barrier for implementation at other institutions. Further research is needed to compare our DCE-MRI findings with areas of structural abnormalities on CT to better understand the relationship between contrast kinetic changes within areas of fibrosis.
Our study has several limitations. First, IPF and healthy control subjects differed in age and gender. We detected an age effect on our DCE-MRI measurements, as detailed earlier. Whether gender differences could have confounded our results is not known. Second, a proportion of IPF subjects were former smokers, whereas the healthy control subjects denied prior tobacco use. Third, we did not exclude IPF subjects based on the presence of emphysema or pulmonary hypertension, which may confound the microvasculature measurements; however, washout rates should be affected minimally, if at all. Lastly, we did not perform histological comparison of the modelling of the DCE-MRI signal to confirm the pathologic correlates of our findings.
In summary, our results provide potentially important information regarding alterations in the microvasculature and extravascular extracellular space in IPF, which may have prognostic and future therapeutic implications. Further research is needed to validate our findings and to determine whether DCE-MRI can be utilised to detect early changes with antifibrotic therapies.
Supplementary material
Supplementary Material
Please note: supplementary material is not edited by the Editorial Office, and is uploaded as it has been supplied by the author.
Supplementary material 00907-2020.SUPPLEMENT
Footnotes
Provenance: Submitted article, peer reviewed.
Author contributions: S.B. Montesi and P. Caravan designed the study. All authors performed data collection, analysis and/or interpretation of data. S.B. Montesi and I. Zhou drafted the manuscript. All authors contributed to a critical review of the manuscript and provided final approval for submission.
This article has supplementary material available from openres.ersjournals.com
Conflict of interest: S.B. Montesi reports grants from the CHEST Foundation, the Francis Family Foundation and the National Institutes of Health during the conduct of the study; and a clinical trial agreement through their institution from United Therapeutics and Pliant Therapeutics, a research agreement through their institution from Merck, payment for clinical trial work through their institution from Promedior, royalties for writing contributions to UpToDate from Wolters Kluwer, and consulting and advisory board fees from DevPro Biopharma, outside the submitted work.
Conflict of interest: I. Zhou has nothing to disclose.
Conflict of interest: L.L. Liang has nothing to disclose.
Conflict of interest: S.R. Digumarthy reports acting as an independent image analyst for clinical trials through their hospital for Merck, Pfizer, Bristol Mayer Squibb, Novartis, Roche, Polaris, Cascadian, Abbvie, Gradalis, Clinical Bay and Zai Laboratories; an honorarium from Siemens Medical Solutions; and a research grant from Lunit INC, all outside the submitted work.
Conflict of interest: S. Mercaldo has nothing to disclose.
Conflict of interest: N. Mercaldo has nothing to disclose.
Conflict of interest: R.T. Seethamraju reports personal fees from Siemens Medical Solutions, USA Inc., outside the submitted work.
Conflict of interest: B. Rosen has nothing to disclose.
Conflict of interest: P. Caravan reports grants from National Institutes of Health during the conduct of the study; and is a founder of and holds equity in Reveal Pharmaceuticals and Collagen Medical LLC (businesses not related to this work), and unrelated research grants from Indalo Therapeutics, Pliant Therapeutics, Celgene, Pfizer and Takeda, outside the submitted work.
Support statement: This work was conducted with support from the CHEST Foundation, the Francis Foundation and the Scleroderma Foundation to S.B. Montesi, and from the NIH (R01HL131907 to P. Caravan and K23HL150331 to S.B. Montesi). Funding information for this article has been deposited with the Crossref Funder Registry.
- Received December 4, 2020.
- Accepted July 21, 2021.
- Copyright ©The authors 2021
This version is distributed under the terms of the Creative Commons Attribution Non-Commercial Licence 4.0. For commercial reproduction rights and permissions contact permissions{at}ersnet.org
References


