


Figures
- FIGURE 1
Primary end-point: cumulative incidence function of sustained clinical improvement or live discharge (full analysis set). AZITHRO: azithromycin; SOC: standard of care.
- FIGURE 2
Forest plot subgroup analyses for primary end-point: time to sustained clinical improvement or discharge (full analysis set). AZITHRO: azithromycin; SOC: standard of care; NC: not calculated.
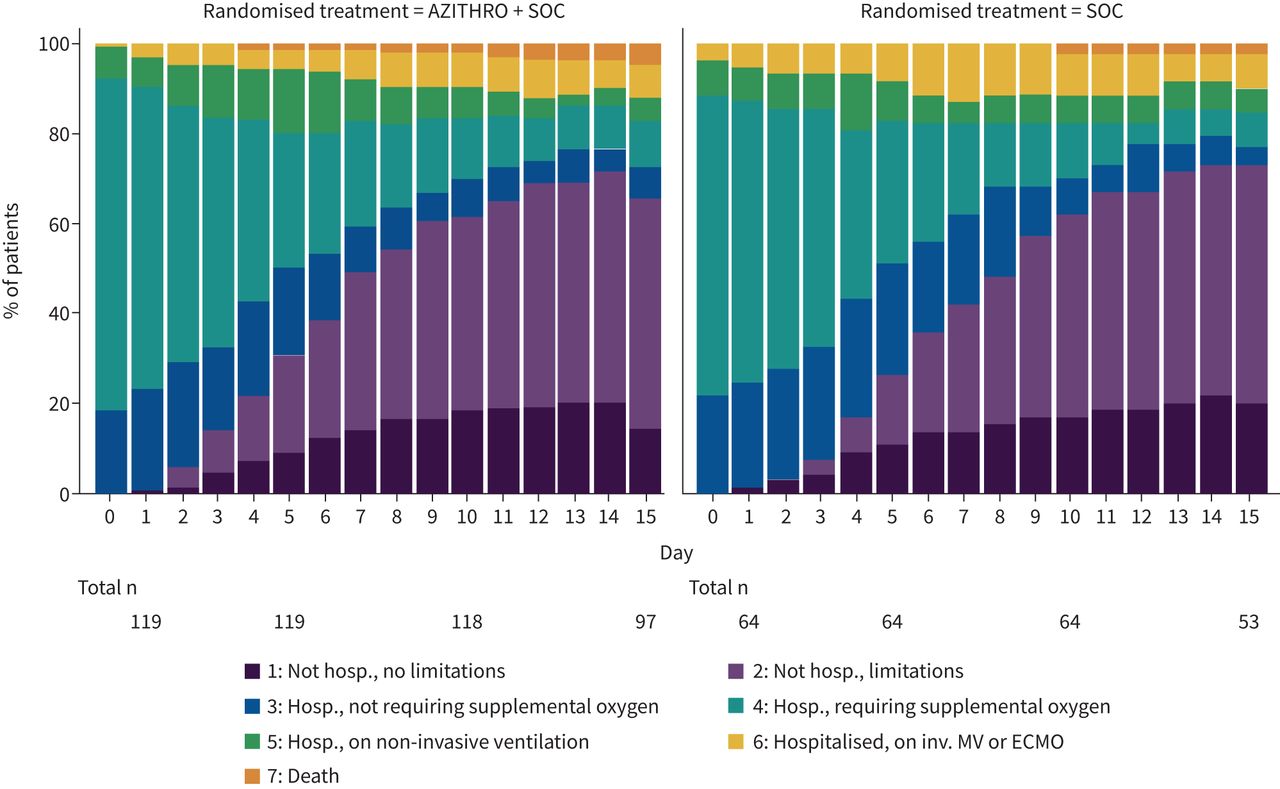
- FIGURE 3
Bar chart of daily clinical status (full analysis set). AZITHRO: azithromycin; SOC: standard of care; Hosp.: hospitalised; inv: invasive; MV: mechanical ventilation; ECMO: extracorporeal membrane oxygenation.


Tables
- TABLE 1
Subject disposition and baseline information: full analysis set/safety set
Full analysis set=safety set Statistic AZITHRO + SOC SOC Total Total number of patients n 119 64 183 Demographics Age years Mean±sd 63±15 59±15 62±15 Female n/N (%) 40/119 (33.61) 30/64 (46.88) 70/183 (38.25) Ethnicity Caucasian n/N (%) 104/119 (87.39) 55/64 (85.94) 159/183 (86.89) North Africa and Middle East n/N (%) 11/119 (9.24) 5/64 (7.69) 16/183 (8.74) Black or sub-Sahara (Africa) n/N (%) 3/119 (2.52) 1/64 (1.56) 4/183 (2.19) Other n/N (%) 1/119 (0.84) 3/64 (4.68) 4/183 (2.19) Medical history Diabetes mellitus n/N (%) 22/119 (18.49) 9/64 (14.06) 31/183 (16.94) Arterial hypertension n/N (%) 55/119 (46.22) 27/64 (42.19) 82/183 (44.81) Arrhythmia n/N (%) 19/119 (15.97) 12/64 (18.75) 31/183 (16.94) Smoking status Active n/N (%) 5/110 (4.55) 4/55 (7.27) 9/165 (5.45) Former n/N (%) 37/110 (33.64) 20/55 (36.36) 57/165 (34.55) Never n/N (%) 68/110 (61.82) 31/55 (56.36) 99/165 (60.00) Chronic pulmonary disease# n/N (%) 4/119 (3.36) 2/63 (3.17) 6/182 (3.30) COPD n/N (%) 7/119 (5.88) 8/64 (12.50) 15/183 (8.20) Asthma n/N (%) 10/119 (8.40) 5/64 (7.81) 15/183 (8.20) Heart failure n/N (%) 8/119 (6.72) 3/64 (4.69) 11/183 (6.01) Ischaemic heart disease n/N (%) 10/119 (8.40) 8/64 (12.50) 18/183 (9.84) Chronic kidney disease n/N (%) 10/119 (8.40) 6/64 (9.38) 16/183 (8.74) Respiratory status at first presentation Signs of respiratory distress at first presentation (i.e. oxygen saturation <93%, PaO2/FIO2 <300 mmHg, respiratory rate >30 breaths·min−1) n/N (%) 57/119 (47.90) 33/61 (54.10) 90/180 (50.00) Respiratory support within first 2 h Oxygen support (oxygen mask or nasal prongs) n/N (%) 89/119 (74.79) 46/63 (73.02) 135/182 (74.18) High-flow oxygen support or noninvasive ventilation n/N (%) 5/119 (4.20) 4/64 (6.25) 9/183 (4.92) Mechanical ventilation n/N (%) 0/119 (0.00) 3/64 (4.69) 3/183 (1.64) ECMO n/N (%) 1/119 (0.84) 0/64 (0.00) 1/183 (0.55) Clinical status at baseline 3) Hosp., not requiring supplemental oxygen n/N (%) 22/119 (18.49) 14/64 (21.88) 36/183 (19.67) 4) Hosp., requiring supplemental oxygen n/N (%) 88/119 (73.95) 43/64 (67.19) 131/183 (71.58) 5) Hosp., on noninvasive ventilation n/N (%) 9/119 (7.56) 5/64 (7.81) 14/183 (7.65) 6) Hosp., on invasive MV or ECMO n/N (%) 0/119 (0.00) 2/64 (3.13) 2/183 (1.09) 7) Death n/N (%) 0/119 (0.00) 0/64 (0.00) 0/183 (0.00) Laboratory parameters at baseline CRP mg·L−1 Ref. ≤5 Median (Q1–Q3) 73.8 (35.2–125.8) 59.5 (23.5–93.3) 68.0 (33.1–119.2) WBC 109/L Ref. 4.0–10.0 Median (Q1–Q3) 6.0 (4.2–8.0) 5.6 (4.1–8.0) 5.8 (4.2–8.0) Lymphocytes 109/L Ref. 1.2–3.6 Median (Q1–Q3) 1.0 (0.7–1.4) 1.0 (0.7–1.3) 1.0 (0.7–1.4) Neutrophils 109/L Ref. 2.5–7.8 Median (Q1–Q3) 4.4 (2.9–6.5) 4.5 (3.4–6.7) 4.5 (3.0–6.6) Ferritin µg·L−1 Ref. 30–400 Median (Q1–Q3) 722.5 (408.0–1057.0) 748.0 (529.0–1420.0) 736.0 (492.0–1259.0) D-dimer µg·L−1 Ref. ≤500 Median (Q1–Q3) 743.0 (466.0–1174.0) 670.0 (378.0–958.0) 723.5 (455.5–1160.0) Fibrinogen g·L−1 Ref. 2.0–3.93 Median (Q1–Q3) 7.7 (5.6–560.0) 139.2 (4.5–547.0) 9.3 (5.3–547.0) eGFR mL·min−1 Ref. ≥60 Median (Q1–Q3) 82.0 (64.0–90.0) 88.0 (74.0–90.0) 85.0 (65.0–90.0) ECG at baseline QTc (MS) (Fridericia formula) n, mean±sd n=111, 418.9±25.3 n=57, 416.5±28.6 n=168, 418.1±26.4 Symptom onset Time from symptom onset to randomisation, days Median (Q1–Q3) 7 (4–10) 7 (5–10) 7 (5–10) AZITHRO: azithromycin; SOC: standard of care; PaO2: arterial oxygen tension; FIO2: inspiratory oxygen fraction; ECMO: extracorporeal membrane oxygenation; Hosp.: hospitalised; MV: mechanical ventilation; Ref: reference value; CRP: C-reactive protein; WBC: white blood cell count; eGFR: estimated glomerular filtration rate. #: not COPD or asthma.
- TABLE 2
Trial primary and secondary end-points: full analysis set (FAS)
Full analysis set (n=183) Statistic Estimate (95% CI) Treatment effect Estimate (95% CI) p-value AZITHRO SOC Primary outcome Incidence of clinical improvement or live discharge Subdistribution HR# 1.023 (0.758–1.379) 0.8839 At 15 days CIF¶ (%) 78.2 (69.5–84.6) 81.3 (69.0–89.0) At 29 days CIF¶ (%) 86.6 (78.9–91.6) 89.1 (77.8–94.8) Time to sustained clinical improvement or live discharge Median (days) 6 (6–8) 8 (6–10) Secondary outcomes (compared to FAS, total n-values may be lower than n=119 for AZITHRO and n=64 for SOC due to missing values+) Clinical status at day 15 n/N (%) Common OR of having lower clinical status at day 15§ 0.83 (0.47–1.53) 0.5776 1) Not hosp., no limitations 14/97 (14.58) 11/53 (20.75) 2) Not hosp., limitations 50/97 (51.55) 28/53 (52.83) 3) Hosp., no supplemental oxygen 7/97 (7.22) 2/53 (3.77) 4) Hosp., requiring oxygen 10/97 (10.31) 4/53 (7.55) 5) Hosp., noninvasive ventilation 5/97 (5.15) 3/53 (5.66) 6) Hospitalised, MV or ECMO 7/97 (7.22) 4/53 (7.55) 7) Death 4/97 (4.12) 1/53 (1.89) Cumulative clinical status up to day 15 Geometric meanƒ 42.61 (39.66–45.77) 42.60 (38.64–46.98) Treatment ratio## 1.00 (0.90–1.12) 0.9508 All-cause mortality 15 days KM (%) 3.4 (1.3–8.7) 1.6 (0.2–10.6) HR¶¶ 1.799 (0.201–16.09) 0.5996 29 days KM (%) 7.6 (4.0–14.0) 6.5 (2.5–16.3) HR¶¶ 1.109 (0.339–3.628) 0.8666 ICU (29 days) Incidence (all patients)¶¶¶ CIF¶ (%) 26.1 (18.5–34.2) 23.4 (13.9–34.4) Subdistribution HR# 1.066 (0.572–1.985) 0.8412 Duration of ICU stay (ICU admitted patients) Median (days) 11 (7–18) 17 (3–28) Subdistribution HR for live discharge from ICU# 1.293 (0.661–2.529) 0.4534 Mechanical ventilation (29 days) Incidence (all patients)¶¶¶ CIF¶ (%) 12.0 (6.9–18.6) 15.6 (8.0–25.6) Subdistribution HR# 0.738 (0.313–1.741) 0.4838 Duration of MV (MV patients) Median (days) 13 (NC–NC) 19 (NC–NC) Subdistribution HR for live weaning from MV# 0.897 (0.263–3.034) 0.8609 Supplemental oxygen (29 days) Incidence (all patients)¶¶¶ CIF¶ (%) 83.2 (75.1–88.9) 79.7 (67.4–87.8) Subdistribution HR# 0.998 (0.837–1.191) 0.7811 Duration of supplemental oxygen (patients with supplemental oxygen)# Median (days) 6 (5–8) 7 (5–11) Subdistribution HR for live weaning from oxygen# 1.042 (0.737–1.479) 0.9465 Hospital stay (29 days) Subdistribution HR for live Occurrence of live hospital discharge CIF¶ (%) 85.8 (78.0–91.0) 84.4 (72.5–91.4) hospital discharge# 1.064 (0.780–1.451) 0.6954 Duration of hospital stay (days)# Median (days) 7 (6–8) 8 (6–9) Safety outcome Combined cardiac end-point (hs-troponin >0.5 ng·mL−1 and/or ventricular arrhythmia requiring intervention and/or sudden cardiac death) n/N (%) 24/119 (20.17) 12/64 (18.75) OR++ 1.40 (0.61–3.19) 0.4265 Exploratory outcomes Normal CT at 5–7 weeks n/N (%) 25/75 (33.33) 12/40 (30.00) OR§§ 1.56 (0.64–3.79) 0.3233 DLCO % predicted Estimated meanƒƒ (%) 66.49 (59.96–73.02) 67.00 (57.91–76.09) Treatment difference### 0.22 (−11.1–11.51) 0.9695 6-min walk test Estimated meanƒƒ (m) 496.5 (465.0–528.0) 456.3 (413.2–499.3) Treatment difference### 32.51 (−21.2–86.25) 0.2383 AZITHRO: azithromycin; SOC: standard of care; CIF: cumulative incidence functions; HR: hazard ratio; OR: odds ratio; Hosp.: hospitalised; MV: mechanical ventilation; ECMO: extracorporeal membrane oxygenation; KM: Kaplan-Meier; ICU: intensive care unit; NC: not calculated; CT: computed tomography; DLCO: diffusing capacity of the lung for carbon monoxide. #: score >1 favours azithromycin; HR was obtained using a Fine & Gray model for competing risk data including treatment, study site and study period as factors. ¶: event rates were estimated as CIF, taking into account the competing risk of death. +: missing data are accounted for by multiple imputation. §: score >1 favours azithromycin; OR was obtained from a multinomial logistic regression with factors for treatment, disease severity and clinical status on day 0. ƒ: geometric mean was obtained using a general linear model including treatment as factor. ##: score >1 favours SOC; treatment ratio was calculated as the ratio of geometric means, obtained using a general linear model including treatment, study site, study period and clinical status on day 0 as factors (note: data were log-transformed prior to statistical analysis). ¶¶: score >1 favours SOC; HR was obtained using log-rank test after event rates were estimated using Kaplan–Meier methodology. ++: score >1 favours SOC; ORs were obtained using logistic regression including treatment, study site and study period as factors in the model. §§: score >1 favours azithromycin; ORs were obtained using logistic regression including treatment, study site and study period as factors in the model. ƒƒ: obtained using a general linear model including treatment as factor. ###: higher score (>0) favours azithromycin; obtained using a general linear model including treatment, study site and period as factors. ¶¶¶: score >1 favours SOC; HR was obtained using a Fine & Gray model for competing risk data including treatment, study site and study period as factors.
Supplementary Material
Please note: supplementary material is not edited by the Editorial Office, and is uploaded as it has been supplied by the author.
Supplementary material 00610-2021.SUPPLEMENT


