


Figures
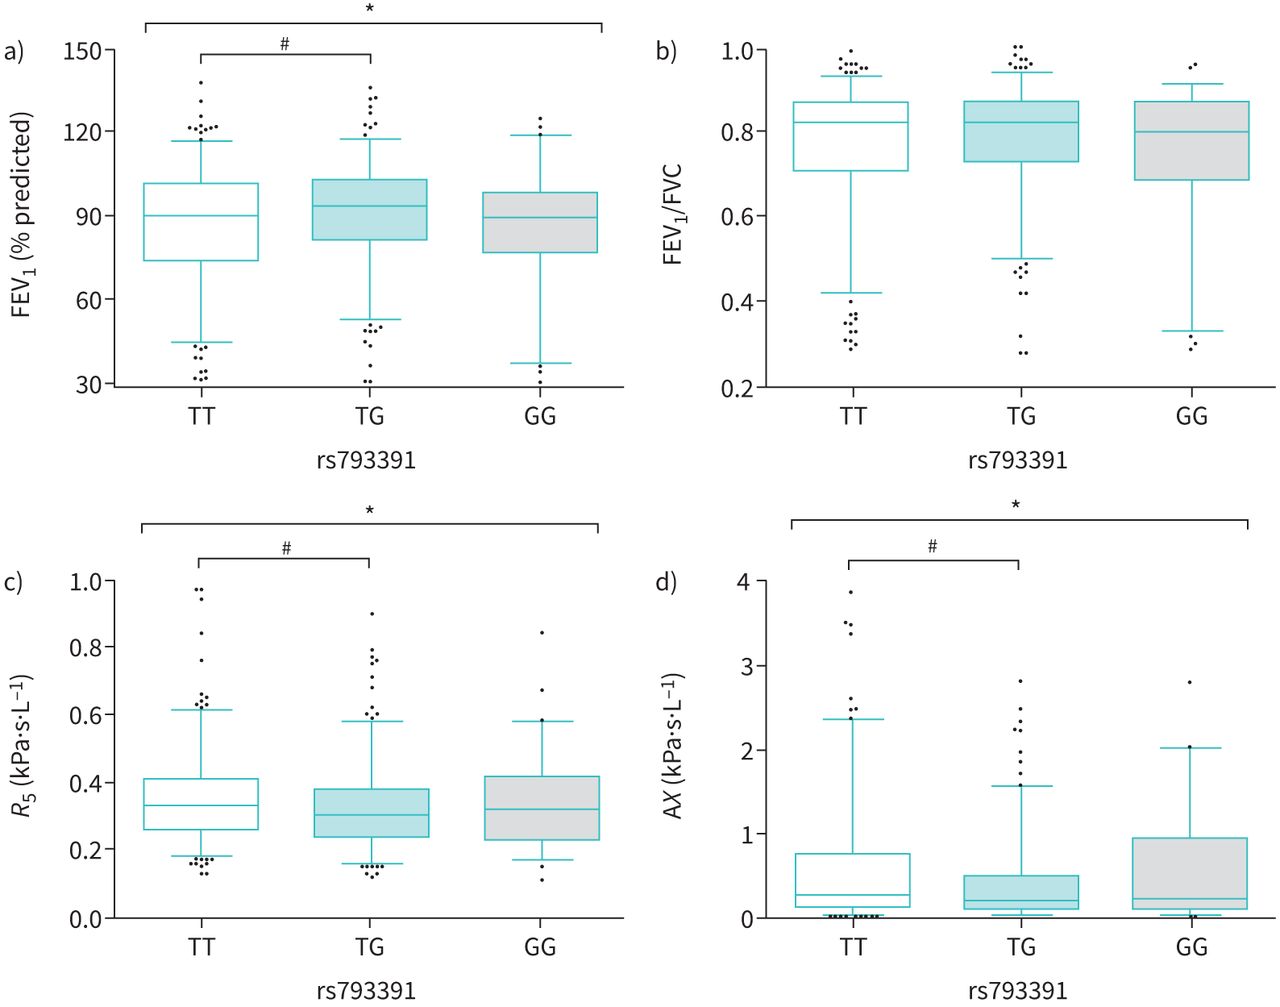
- FIGURE 1
Lung function in COPD patients and controls divided by single nucleotide polymorphism rs793391 genotypes (as representative for block 2). a) Forced expiratory volume in 1 s (FEV1), b) FEV1/forced vital capacity (FVC) ratio, c) resistance at 5 Hz (R5) and d) reactance area (AX) are divided according to the genotype of rs793391. One-way ANOVA was used for overall comparison among the groups (*: p<0.05), followed by Bonferroni's multiple comparison test between separate groups (#: p<0.05). Genotypes are presented with the reference/reference genotype to the left. Data are presented as box-plots showing the median within the box of 25th–75th percentile and whiskers of 5th–95th percentile.
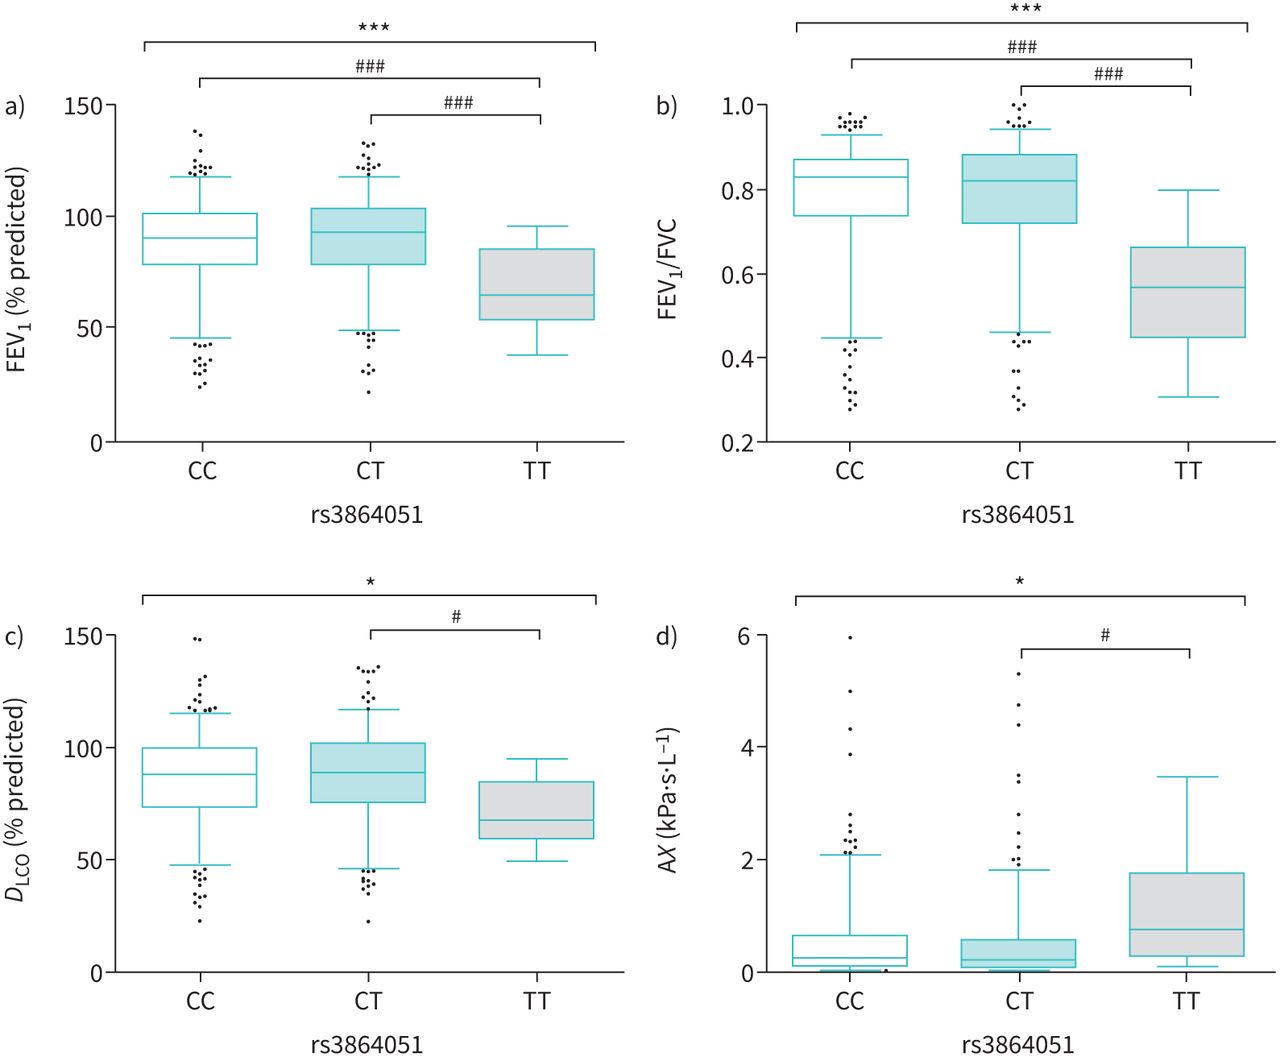
- FIGURE 2
Lung function in COPD patients and controls divided by single nucleotide polymorphism rs3864051 genotypes. a) Forced expiratory volume in 1 s (FEV1), b) FEV1/forced vital capacity (FVC), c) diffusing capacity of the lung for carbon monoxide (DLCO) and d) reactance area (AX) are divided according to the genotype of rs3864051. One-way ANOVA was used for overall comparison among the groups (*: p<0.05, ***: p<0.001), followed by Bonferroni's multiple comparison test between separate groups (#: p<0.05, ###: p<0.001). Genotypes are presented with the reference/reference genotype to the left. Data are presented as box-plots showing the median within the box of 25th–75th percentile and whiskers of 5th–95th percentile.
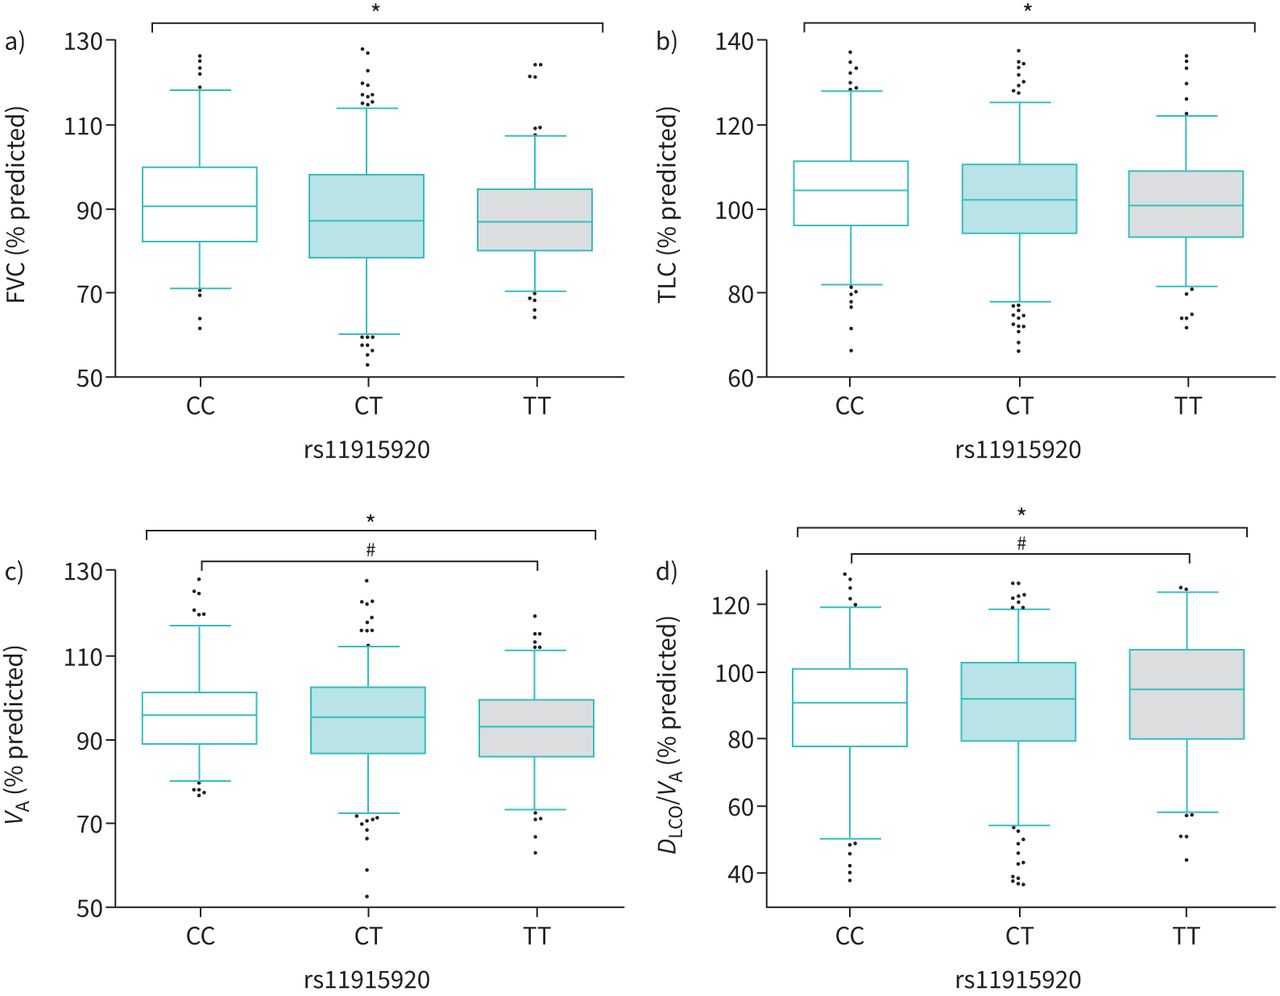
- FIGURE 3
Lung function in COPD patients and controls divided by single nucleotide polymorphism rs11915920 genotypes (as representative for block 1). a) Forced vital capacity (FVC), b) total lung capacity (TLC), c) alveolar volume (VA) and d) diffusing capacity of the lung for carbon monoxide (DLCO)/VA are divided according to the genotype of 11915920. One-way ANOVA was used for overall comparison among the groups (*: p<0.05), followed by Bonferroni's multiple comparison test between separate groups (#: p<0.05). Genotypes are presented with the reference/reference genotype to the left. Data are presented as box-plots showing the median within the box of 25th–75th percentile and whiskers of 5th–95th percentile.


Tables
- TABLE 1
Patient characteristics and lung function
Controls COPD p-value Patients 405 154 Female/male 239/166 (59/41) 71/83 (46/54) 0.006 Age, years 62±8 66±6 <0.001 Weight, kg 77±16 77±15 0.99 Height, cm 170±9 171±9 0.025 Smoking status, never-/former/current smoker 76/145/184 5/92/57 <0.001 Smoking, pack-years 22±18 36±20 <0.001 GOLD stage 1/2/3/4 NA 23/96/31/4 NA Lung function FEV1, L 2.85±0.71 1.87±0.64 <0.001 FEV1, % pred 97±13 63±17 <0.001 FVC, L 3.40±0.85 3.19±1.02 0.023 FVC, % pred 91±12 83±19 <0.001 FEV1/FVC 0.84±0.06 0.60±0.17 <0.001 RV, % pred 116±21 150±45 <0.001 TLC, % pred 102±11 106±17 0.003 DLCO, % pred 93±16 66±20 <0.001 VA, % pred 96±16 91±13 <0.001 DLCO/VA, % pred 97±15 72±20 <0.001 R5, kPa·s·L−1 0.31±0.11 0.41±0.17 <0.001 R20, kPa·s·L−1 0.24±0.08 0.28±0.09 <0.001 R5–R20, kPa·s·L−1 0.07±0.05 0.13±0.10 <0.001 X5, kPa·s·L−1 −0.09±0.05 −0.18±0.13 <0.001 AX, kPa·s·L−1 0.34±0.39 1.13±1.33 <0.001 Data are presented as n, n (%) or mean±sd, unless otherwise stated. Significant differences are depicted in bold. Categorical data were analysed using the Chi-squared test and numeric data were analysed with the t-test. GOLD: Global Initiative for Chronic Obstructive Lung Disease; FEV1: forced expiratory volume in 1 s; FVC: forced vital capacity; RV: residual volume; TLC: total lung capacity; DLCO: diffusing lung capacity of the lung for carbon monoxide; VA: alveolar volume; R5: resistance at 5 Hz; R20: resistance at 20 Hz; X5: reactance at 5 Hz; AX: reactance area; NA: not applicable.
- TABLE 2
Genotype frequencies in healthy and COPD groups, and associations between different genotypes of sulfatase modifying factor (SUMF1) single nucleotide polymorphisms (SNPs)# and COPD
ref/ref ref/var
var/varp-value OR (95% CI)+ Healthy COPD Healthy COPD rs1356229 CC 387 (96) 149 (97) CT 16 (4) 5 (3) 0.74 1.20 (0.42–3.45) TT 0 (0) 0 (0) rs308739 CC 348 (87) 136 (88) TT 54 (13) 18 (12) 0.98 1.01 (0.56–1.82) AA 0 (0) 0 (0) rs4685744 CC 109 (27) 43 (28) CT 187 (46) 73 (47) 0.83 0.95 (0.60–1.51) TT 107 (27) 38 (25) 0.60 0.87 (0.51–1.47) rs2819562 CC 87 (22) 36 (23) CT 182 (45) 74 (48) 0.63 0.89 (0.54–1.45) TT 133 (33) 44 (29) 0.29 0.75 (0.44–1.28) rs2819561 AA 87 (22) 36 (23) AG 183 (46) 74 (48) 0.61 0.88 (0.54–1.44) GG 132 (33) 44 (29) 0.29 0.75 (0.44–1.29) rs2633852 AA 85 (21) 36 (23) AG 181 (45) 74 (48) 0.61 0.88 (0.54–1.44) GG 134 (34) 44 (29) 0.26 0.73 (0.43–1.26) rs11915920 CC 111 (28) 43 (28) CT 186 (46) 75 (49) 0.99 1.00 (0.63–1.58) TT 105 (26) 36 (23) 0.55 0.85 (0.50–1.45) rs807785 CC 33 (8) 17 (11) CT 164 (41) 70 (45) 0.88 0.95 (0.49–1.85) TT 206 (51) 67 (44) 0.39 0.75 (0.39–1.46) rs3864051 CC 228 (57) 69 (45) CT 171 (43) 74 (48) 0.13 1.36 (0.92–2.03) TT 2 (0.5) 11 (7) 0.001 14.22 (3.04–66.49) rs794187 CC 163 (41) 68 (44) CT 190 (47) 70 (46) 0.37 0.83 (0.55–1.25) TT 49 (12) 16 (10) 0.46 0.78 (0.41–1.50) rs794185 TT 114 (28) 52 (34) TC 211 (52) 76 (49) 0.15 0.73 (0.47–1.12) CC 78 (19) 26 (17) 0.33 0.75 (0.43–1.34) rs2322683 CC 53 (13) 20 (13) CT 181 (45) 56 (37) 0.51 0.81 (0.44–1.50) TT 169 (42) 77 (50) 0.46 1.25 (0.69–2.29) rs793391 TT 174 (43) 81 (53) TG 185 (46) 54 (35) 0.013 0.59 (0.39–0.89) GG 44 (11) 19 (12) 0.70 0.88 (0.48–1.64) rs12634249 CC 225 (56) 96 (62) CA 157 (39) 46 (30) 0.034 0.63 (0.42–0.97) AA 21 (5) 12 (8) 0.56 1.26 (0.58–2.73) rs2819590 CC 192 (48) 91 (59) CT 175 (44) 47 (31) 0.006 0.55 (0.36–0.84) TT 33 (8) 16 (10) 0.97 1.01 (0.52–1.98) rs304092 GG 191 (47) 86 (56) GA 176 (44) 53 (34) 0.031 0.63 (0.42–0.96) AA 35 (9) 15 (10) 0.88 0.95 (0.48–1.86) Data are presented as n (%), unless otherwise stated. Significant associations are depicted in bold. #: SNPs are sorted according to chromosome localisation (chromosome localisation is from GRCh38.p12); ¶: logistic regression between reference allele (ref)/ref and ref/variance allele (var) or var/var as indicated, and adjusted for age, sex and smoking status; +: odds ratio of having COPD depending on allele on different SNP in SUMF1.
- TABLE 3
Associations between different genotypes of sulfatase modifying factor (SUMF1) single nucleotide polymorphisms and forced expiratory volume in 1 s (FEV1), forced vital capacity (FVC) and FEV1/FVC ratio in the total study population including both COPD and control subjects
ref/ref ref/var FEV1 FVC FEV1/FVC var/var rs4685744 CC CT 0.82 0.030
B= −0.120.093
B=0.024TT 0.81 0.037
B= −0.140.27 rs2819562 CC CT 0.79 0.048
B= −0.120.076
B=0.027TT 0.73 0.057
B= −0.130.074
B=0.030rs2819561 AA AG 0.76 0.050
B= −0.120.073
B=0.0028GG 0.71 0.060
B= −0.120.076
B=0.029rs2633852 AA AG 0.72 0.062
B= −0.120.075
B=0.028GG 0.67 0.071
B= −0.120.073
B=0.030rs11915920 CC CT 0.98 0.021
B= −0.130.15 TT 0.84 0.031
B= −0.140.23 rs807785 CC CT 0.87 0.64 0.61 TT 0.41 0.87 0.16 rs3864051 CC CT 0.48 0.14 0.67 TT <0.001
B= −0.640.31 <0.001
B= −0.20rs794187 CC CT 0.028
B=0.120.062
B=0.0940.22 TT 0.72 0.62 0.98 rs794185 TT TC 0.002
B=0.180.004
B=0.160.11 CC 0.033
B=0.160.057
B=0.130.32 rs2322683 CC CT 0.17 0.25 0.41 TT 0.87 0.57 0.82 rs793391 TT TG 0.024
B=0.120.42 0.039
B=0.026GG 0.66 0.65 0.79 rs12634249 CC CA 0.039
B=0.110.30 0.060
B=0.024AA 0.12 0.89 0.077
B= −0.045rs2819590 CC CT 0.010
B=0.140.36 0.016
B=0.030TT 0.76 0.74 0.42 rs304092 GG GA 0.025
B=0.120.44 0.037
B=0.026AA 0.99 0.53 0.39 Data are presented as p-values from linear regression between the reference allele (ref)/ref and ref/variance allele (var) or var/var (using ref/ref as reference genotype) as indicated, and adjusted for age, sex, height and smoking status. B-value is the unstandardised β-value, and is presented when p<0.1. Significant associations are depicted in bold.
- TABLE 4
Associations between different genotypes of sulfatase modifying factor (SUMF1) single nucleotide polymorphisms and diffusing capacity and lung volumes in the total study population including both COPD and control subjects
ref/ref ref/var DLCO VA DLCO/VA RV TLC var/var rs4685744 CC CT 0.26 0.23 0.080
B=0.0480.46 0.088
B= −0.14TT 0.14 0.006
B= −0.220.0
B=0.110.068
B=−0,150.009
B= −0.25rs2819562 CC CT 0.12 0.41 0.023
B=0.0670.49 0.13 TT 0.041
B=0.380.083
B= −0.14<0.001
B=0.110.068
B=−0.150.024
B= −0.22rs2819561 AA AG 0.12 0.41 0.023
B=0.0670.47 0.12 GG 0.036
B=0.390.090
B= −0.14<0.001
B=0.110.069
B=−0.150.027
B= −0.21rs2633852 AA AG 0.12 0.40 0.022
B=0.0680.41 0.11 GG 0.044
B=0.380.099
B= −0.140.001
B=0.110.062
B= −0.150.025
B= −0.22rs11915920 CC CT 0.37 0.19 0.12 0.56 0.10
B= −0.14TT 0.11 0.010
B= −0.21<0.001
B=0.110.059
B= −0.150.012
B= −0.24rs807785 CC CT 0.91 0.38 0.75 0.26 0.062
B= −0.24TT 0.72 0.87 0.67 0.18 0.23 rs3864051 CC CT 0.12 0.057
B=0.110.70 0.56 0.063
B=0.13TT 0.029
B= −1.010.49 0.080
B= −0.140.16 0.29 rs794187 CC CT 0.15 0.030
B=0.130.81 0.67 0.69 TT 0.67 0.94 0.64 0.80 0.91 rs794185 TT TC 0.091
B=0.260.001
B=0.220.86 0.32 0.36 CC 0.14 0.29 0.33 0.37 0.76 rs2322683 CC CT 0.96 0.061
B=0.170.35 0.66 0.22 TT 0.82 0.50 0.49 0.91 0.26 rs793391 TT TG 0.34 0.064
B=0.110.86 0.44 0.92 GG 0.70 0.64 0.91 0.51 0.50 rs12634249 CC CA 0.84 0.58 0.92 0.022
B= −0.140.29 AA 0.18 0.73 0.25 0.27 0.81 rs2819590 CC CT 0.32 0.078
B=0.110.73 0.28 0.54 TT 0.45 0.91 0.39 0.16 0.52 rs304092 GG GA 0.43 0.095
B=0.100.89 0.45 0.48 AA 0.78 0.71 0.52 0.28 0.60 Data are presented as p-values from linear regression between the reference allele (ref)/ref and ref/variance allele (var) or var/var as indicated, and adjusted for age, sex, height and smoking status. B-value is the unstandardised β-value, and is shown when p<0.1. Significant associations are depicted in bold. DLCO: diffusing capacity of the lung for carbon monoxide; VA: alveolar volume; RV: residual volume; TLC: total lung capacity.
- TABLE 5
Associations between different genotypes of sulfatase modifying factor (SUMF1) single nucleotide polymorphisms and airway resistance and reactance measured by impulse oscillometry in the total study population including both COPD and control subjects
ref/ref ref/var R5 R20 R5–R20 X5 AX var/var rs4685744 CC CT 0.56 0.35 0.82 0.83 0.72 TT 0.32 0.46 0.44 0.64 0.95 rs2819562 CC CT 0.32 0.41 0.28 0.52 0.21 TT 0.69 0.82 0.80 0.95 0.61 rs2819561 AA AG 0.31 0.41 0.27 0.50 0.20 GG 0.67 0.85 0.74 0.94 0.63 rs2633852 AA AG 0.27 0.33 0.26 0.48 0.19 GG 0.83 0.99 0.86 0.97 0.55 rs11915920 CC CT 0.61 0.36 0.89 0.70 0.85 TT 0.33 0.52 0.39 0.65 0.92 rs807785 CC CT 0.45 0.85 0.14 0.13 0.22 TT 0.49 0.76 0.15 0.095
B=0.0220.26 rs3864051 CC CT 0.29 0.45 0.39 0.21 0.36 TT 0.032
B=0.0790.43 0.003
B=0.0620.005
B= −0.0670.009
B=0.61rs794187 CC CT 0.086
B= −0.0200.72 0.013
B= −0.0170.018
B=0.0180.015
B= −0.18TT 0.79 0.93 0.56 0.91 0.79 rs794185 TT TC 0.002
B= −0.0390.14 <0.001
B= −0.026<0.001
B=0.030<0.001
B= −0.30CC 0.030
B= −0.0350.39 0.004
B= −0.0260.031
B=0.0230.020
B= −0.24rs2322683 CC CT 0.21 0.33 0.27 0.11 0.11 TT 0.62 0.89 0.48 0.89 0.81 rs793391 TT TG 0.014
B= −0.0290.16 0.007
B= −0.0180.012
B=0.0190.008
B= −0.20GG 0.60 0.71 0.61 0.96 1.00 rs12634249 CC CA 0.13 0.68 0.029
B= −0.0140.024
B=0.0170.028
B= −0.16AA 0.39 0.87 0.30 0.59 0.48 rs2819590 CC CT 0.010
B= −0.0300.048
B= −0.0140.021
B= −0.0150.025
B=0.170.011
B= −0.19TT 0.85 0.92 0.84 0.65 0.71 rs304092 GG GA 0.010
B= −0.0300.053
B= −0.0140.018
B= −0.0160.029
B=0.0170.022
B= −0.17AA 0.81 0.78 0.92 0.69 0.66 Data are presented as p-values from linear regression between the reference allele (ref)/ref and ref/variance allele (var) or var/var, adjusted for age, sex, height and smoking status. B-value is the unstandardised β-value and is shown when p<0.1. Significant associations are depicted in bold. R5: resistance at 5 Hz; R20: resistance at 20 Hz; X5: reactance at 5 Hz; AX: reactance area.
Supplementary Material
Please note: supplementary material is not edited by the Editorial Office, and is uploaded as it has been supplied by the author.
Supplementary material 00668-2021.SUPPLEMENT
Figure S1 00668-2021.FIGURES1


