


Expiratory reactance abnormalities in patients with expiratory dynamic airway collapse: a new application of impulse oscillometry
- David I. Fielding1⇑,
- Justin Travers2,
- Phan Nguyen3,
- Michael G. Brown1,
- Gunter Hartel4 and
- Stephen Morrison1
- 1Dept of Thoracic Medicine, Royal Brisbane and Women's Hospital, Herston, Australia
- 2Dept of Thoracic Medicine, Hutt Valley District Health Board, Lower Hutt, New Zealand
- 3The Dept of Thoracic Medicine, The Royal Adelaide Hospital, Adelaide, Australia
- 4Statistics Unit, QIMR Berghofer, Herston, Australia
- David Fielding, Dept of Thoracic Medicine, Royal Brisbane and Women's Hospital, Herston, Qld 4029, Australia. E-mail david_fielding{at}health.qld.gov.au
Abstract
Expiratory dynamic airways collapse (EDAC) is a condition that affects the central airways; it is not well characterised physiologically, with relatively few studies. We sought to characterise impulse oscillometry (IOS) features of EDAC in patients with normal spirometry. Expiratory data were hypothesised to be the most revealing. In addition, we compared IOS findings in chronic obstructive pulmonary disease (COPD) patients with and without EDAC.
EDAC was identified at bronchoscopy as 75–100% expiratory closure at the carina or bilateral main bronchi. Four patient groups were compared: controls with no EDAC and normal lung function; lone EDAC with normal lung function; COPD-only patients; and COPD patients with EDAC.
38 patients were studied. Mean IOS data z-scores for EDAC compared to controls showed significantly higher reactance (X) values including X at 5 Hz, resonance frequency and area under the reactance curve (AX). EDAC showed significantly greater expiratory/inspiratory differences in all IOS data compared to controls. Stepwise logistic regression showed that resonant frequency best discriminated between EDAC and normal control, whereas classification and regression tree analysis found AX ≥3.523 to be highly predictive for EDAC in cases with normal lung function (14 out of 15 cases, and none out of eight controls).
These data show a new utility of IOS: detecting EDAC in patients with normal lung function.
Abstract
Central airway expiratory dynamic airway collapse can be “silent” on breathing tests, but impulse oscillometry can reveal it http://ow.ly/9oIb30lIOka
Introduction
Expiratory dynamic airway collapse (EDAC) is a phenomenon seen at bronchoscopy in the trachea and main bronchi [1–3]. It is defined as reduction of central airway diameter in quiet breathing due to invagination of the posterior membrane of the trachea with no cartilage weakness [1]. Most authorities recommend only diagnosing the condition when the degree of obstruction is complete or near complete (>90%) although degrees of narrowing of 50% or 80% have been used [4–10]. Symptoms of EDAC may include cough, breathlessness and mucus retention [11, 12]. EDAC has remained difficult to detect physiologically, and there is a particular need for a physiological way to monitor for effects of treatment such as continuous positive airway pressure (CPAP) and surgical stabilisation of the trachea [1, 6, 13].
EDAC may occur in chronic obstructive pulmonary disease (COPD) due to loss of elastic recoil [14–16]. However, EDAC can be seen at bronchoscopy in patients who have no peripheral airways disease [6, 12]. If such a striking abnormality is occurring, why is it often not detectable at conventional lung function testing [16]?
Impulse oscillometry (IOS) provides a non-invasive means to detect airways obstruction [17, 18]. IOS analyses the response of the respiratory system to externally applied pressure signals and their resultant flows. Airway obstruction is inferred from the pattern of respiratory system resistance (R) as a function of oscillation frequency and [19–22]. Reactance (X) is the sum of inertance of the moving air column in conducting airways and capacitance (the ability to store capacitative energy) [17, 21]. Resonant frequency (fres) is the point where reactance is zero. IOS allows analysis of intrabreath variation [23].
Horan et al. [20] studied the utility of IOS in determining tracheal diameter in subglottic stenosis. There was good correlation between large airway diameter and fres. Impedance (the sum of X and R) and R at 5 Hz (R5) were well correlated with this diameter; however, spirometry was not correlated with the diameter. We hypothesised that these results of fixed tracheal obstruction could be applied to patients with EDAC, where IOS abnormalities would be more marked in expiration. The main question was whether IOS could demonstrate these abnormalities in patients with EDAC who have normal lung function, that is, absence of classic peripheral airways obstruction. A secondary question was to compare IOS data of lone EDAC patients to patients with peripheral airway disease (COPD).
Delaccà et al. [24] have demonstrated that the oscillation technique could detect expiratory flow limitation (EFL) in COPD patients during quiet breathing using expiratory reactance. Importantly, this study of 15 COPD patients compared to seven controls defined thresholds for expiratory reactance parameters that resulted in a 100% sensitivity and specificity for the presence of flow limitation at rest. We further hypothesised that by measuring these indices we might show EFL in expiration, and hence develop a test for the physiological impact of EDAC.
Methods
The study was approved by the institutional ethics committee, and all patients gave written informed consent for the study and for bronchoscopy. This prospective cross-sectional study took place in Brisbane, Australia, between June 2007 and June 2017.
Subjects
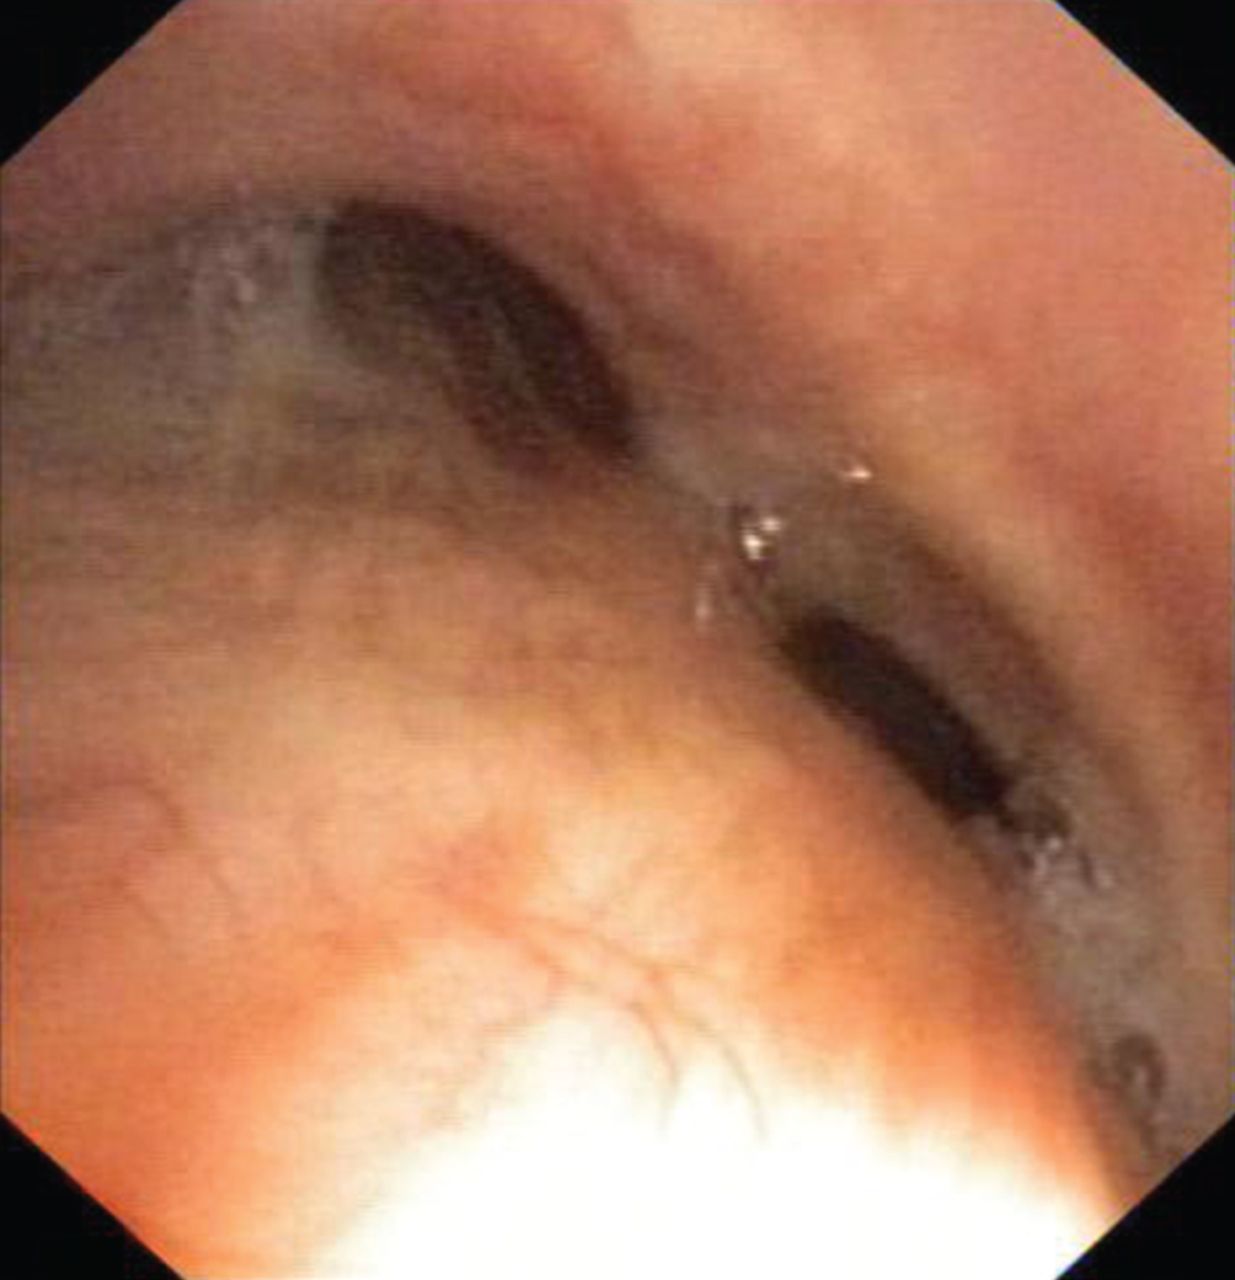
Patients (including controls) were those attending a tertiary referral hospital thoracic medicine outpatient department for investigation of chronic cough, minor haemoptysis or unexplained breathlessness. Workup included either bronchoscopy (in the majority of patients) and/or dynamic chest computed tomography (in one patient). Patients with lung parenchymal infiltrates or large airway extrinsic compression, stenosis or endolumenal obstruction were excluded. Bronchoscopy was performed with conscious sedation by experienced proceduralists. During quiet breathing (not coughing) our EDAC cases were defined as severe or complete (75–100%) closure of either main bronchi or trachea in quiet expiration [1] (figure 1). Patients with tracheomalacia with tracheal cartilage weakness were not included. EDAC cases were identified consecutively, and control cases (with a normal bronchoscopy) were selected nonconsecutively over time to have similar height and age.
Lung function tests
Lung function tests (spirometry, single-breath carbon monoxide gas transfer and static lung volumes by plethysmography) were performed on all subjects (Jaeger MS-PFT; Viasys Healthcare, Höchberg, Germany). Flow–volume loops were inspected for the saw-tooth pattern reported to suggest large airway obstruction. Subjects were divided into four groups. Controls had normal lung function and no evidence of EDAC on bronchoscopy; EDAC had normal lung function, but had EDAC at bronchoscopy as defined earlier. There were two COPD groups defined as forced expiratory volume in 1 s (FEV1)/forced vital capacity (FVC) ratio <0.7 [21]. One group had no EDAC and the other group had EDAC in addition, as defined earlier. Patients in each group were obtained consecutively. Those performing lung function tests and IOS were blinded to the bronchoscopy findings.
IOS testing
The IOS studies were performed on a Viasys Healthcare Jaeger IOS version 5.1. Patients wore a nose peg and breathed quietly in a sitting position on the mouthpiece with cheeks gently compressed by the patient. Three runs were performed for each patient and the means derived for all values. In addition, inspiratory and expiratory data were collected prospectively. No particular breathing rate was specified other than to “breathe quietly”. Figure 2 demonstrates the measured IOS features, including R, X, z-score and area under the X curve (AX). Predicted values were from published formulae [26] and accounted for body weight and expressed as z-scores. Inspiratory and expiratory data were compared using measured values (as there are no predicted values for inspiratory and expiratory data).

Bronchoscopic view of example of expiratory dynamic airways collapse case with near total closure of left and right main bronchus at main carina.

a) Impulse oscillometry trace in a control patient showing resistance and reactance (three measurements each). The resistance trace is relatively flat, with no significant change by changing frequency of impulse. Here the reactance trace crosses the baseline at 10 Hz, the resonant frequency. b) Expiratory dynamic airways collapse case (normal conventional lung function); higher resistance is seen at lower frequency, and raised resonance frequency (28 Hz). The reactance curve shows a plateau at 10–15 Hz.
When testing for the presence of flow limitation we used the thresholds derived by Dellacà et al. [24] for mean X5, minimum X5 on expiration, ΔX and X peak-to-peak, which were −5.4, −7.1, 2.8 and 6.0 cmH2O·s−1·L−1, respectively.
Statistics
Baseline demographic and lung function data are presented for each of the four groups (control, EDAC, COPD and COPD with EDAC) and Dunnett's multiple comparison method used to compare each versus the control group.
Baseline IOS data are presented as z-scores, with a z-score of −1.64 sd delineating the 5th percentile. z-score use predicted values which account for age, sex, height and body weight. These values were compared using two-tailed t-tests.
Stepwise logistic regression and classification and regression trees (CARTs) were used for identification of the most important IOS variables in separating EDAC from controls and in separating COPD with EDAC from COPD without EDAC and building predictive models. Predictive ability of the models was assessed with misclassification rates and area under the receiver operating curve (AUC), presented with bootstrap 95% confidence intervals. Tree-structured regression offers an interesting alternative for looking at regression type problems, as models are based on subsetting based on cut-off values on continuous variables rather than linear combinations, as in regression modelling.
Results
Clinical parameters
A total of 41 patients were studied. Of these, three patients were excluded: one patient had persistent cough during testing, another made efforts to control her breathing pattern during expiration to minimise cough and one patient with normal spirometry had diffuse mucosal airway bleeding at bronchoscopy due to low-grade chronic bronchitis. This left 38 patients for analysis. Table 1 shows basic demographic and lung function data for the four groups of patients. 23 patients had EDAC. In the EDAC group, all patients had bronchoscopy to investigate chronic cough, except for one patient who was investigated for postoperative respiratory failure after abdominal surgery. In the EDAC patients, airway collapse was observed in the lower trachea and proximal main bronchi, and in the non-COPD patients this central airway collapse was more obvious than collapse of segmental or subsegmental airways. Some patients with higher body mass index (BMI) had mild reduction in vital capacity and therefore in mid-expiratory flow rates; however, the FEV1/FVC ratio was non-obstructive. EDAC patients had a higher BMI than controls. Note that in IOS measures the predicted values and z-scores used were based on body weight, therefore accounting for this body weight difference in the groups. Flow–volume loops showed a saw-tooth pattern in only three of the EDAC patients, and three of the COPD plus EDAC patients. Clinical outcomes are presented in the online supplementary material.
Basic demographic and lung function data
IOS results mean values
Table 2 shows results of IOS studies, with comparisons made to controls using Dunnett's multiple comparison method. For R5 the highest results were in the COPD groups; however, the EDAC group also showed significantly elevated values for R5. Resistance at 20 Hz (R20) values were only significantly elevated in the COPD group. Reactance values (X5) were significantly elevated in all groups, with the lone EDAC group being similarly affected to the COPD groups. In addition, the fres and AX values were similarly markedly different to controls as a result of changes in X.
Impulse oscillometry data (combined inspiratory and expiratory)
IOS results: inspiratory versus expiratory
Table 3 shows inspiratory and expiratory IOS data for the (lone) EDAC group compared to controls. EDAC patients had significantly different R5, X5, fres and AX results in expiration compared to inspiration, with AX being the most significant. Note that while controls did have significantly different R5 values on expiration compared to inspiration, these differences (Δ values) were significantly greater in the EDAC group. Figure 3 shows reactance curves in inspiration and expiration in an EDAC patient with clearly more negative reactance in expiration.
Inspiratory versus expiratory impulse oscillometry data

An example of reactance curves in an expiratory dynamic airways collapse patient in inspiration and expiration showing significant impact of expiration. Area under the reactance curve values <30 Hz.
The magnitude of EDAC IOS changes were generally similar to the two COPD groups, particularly for reactance. When comparing the two COPD groups with and without EDAC no statistically significant differences for Δ values (degree of difference between inspiration and expiration) was shown (online supplementary table S1). That is, COPD plus EDAC did not have a greater Δ values than COPD alone.
Table 4 shows results of IOS values defined by Dellacà et al. [24] to represent indices where there was airflow limitation at rest. All of these were significantly different for EDAC patients. Comparing the two COPD groups with and without EDAC, there were no significant differences for these indices.
Comparison of expiratory dynamic airway collapse (EDAC) patients with controls for values as defined by Dellacà et al. [24] from analyses of inspiratory and expiratory measurements of impulse oscillometry data
Figure 4 shows X5 for the peak-to-peak value expressed in relation to the threshold point for this value, where expiratory flow limitation in quiet breath was observed by Dellacà et al. [24]. It shows that for peak-to-peak and measures there were four patients who met the threshold criteria for expiratory flow limitation at rest.
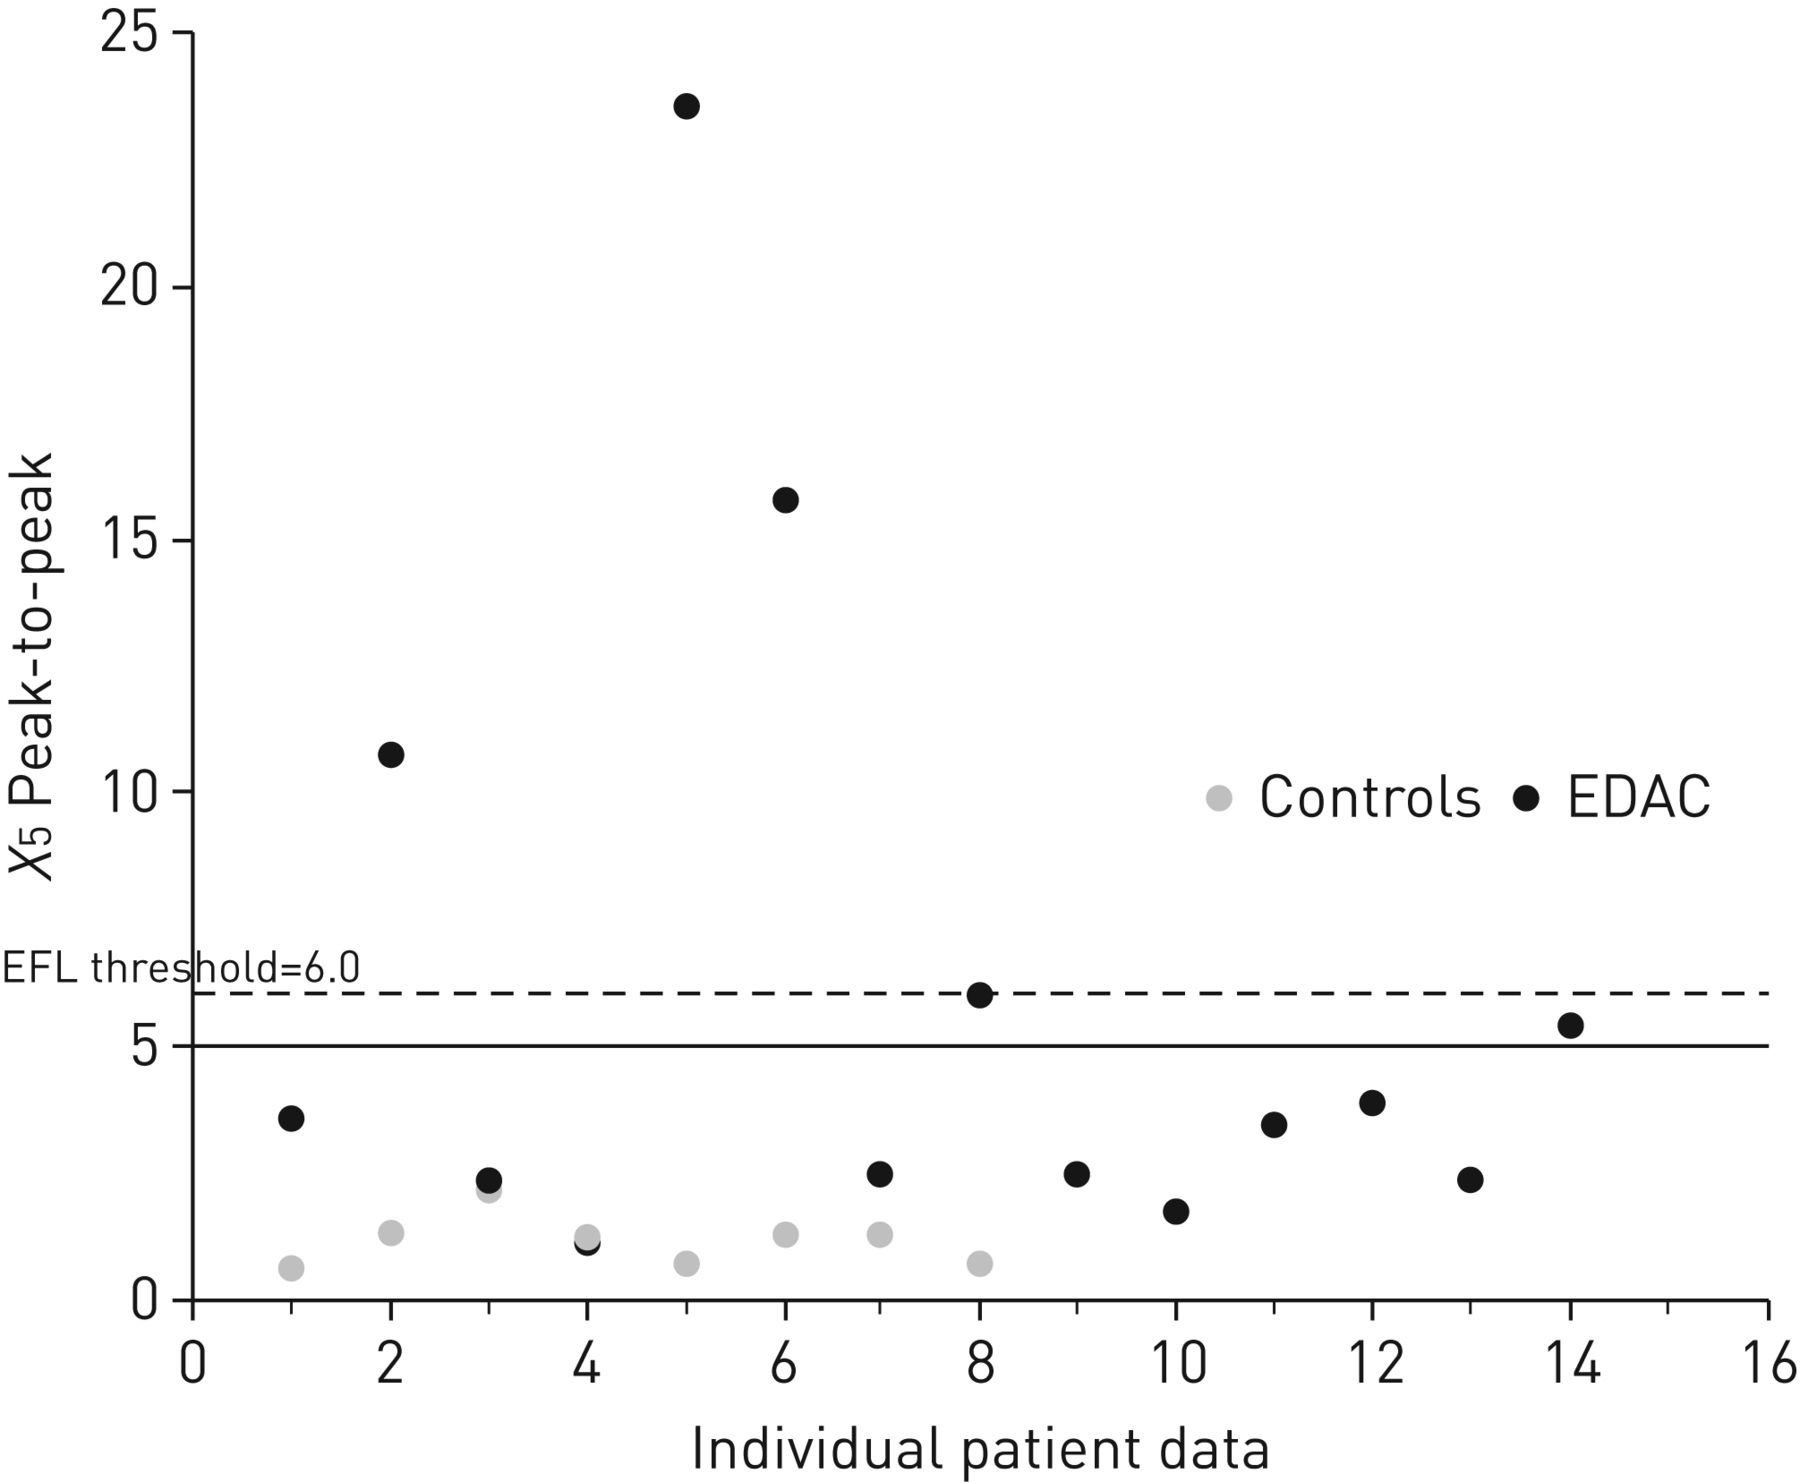
Peak-to-peak reactance at 5 Hz (X5) values for expiratory dynamic airways collapse patients. The threshold value for expiratory flow limitation (EFL) as defined by Dellacà et al. [24] is 6.0.
In terms of resistance values, we did not find that EDAC patients had a central airway phenotype: five cases showed with peripheral obstruction on expiration only; two cases had mixed obstruction on both inspiratory and expiratory data; two cases had mixed obstruction on expiratory data only; and six cases showed no evidence of obstruction (online supplementary table S1).
Stepwise logistic regression
A stepwise logistic regression was used to determine which combination of IOS and lung function parameters best predict EDAC versus normal patients. IOS parameters included R5, R20, X5, AX, fres, ΔR5, ΔR20, ΔX5, Δfres, ΔAX, mean X5 expiratory, min X5 expiratory, ΔX5 and peak-to-peak X5. Lung function parameters included FEV1, FVC, FEV1/FVC ratio, mid-expiratory flow rate percentage, total lung capacity (TLC), residual volume (RV) and diffusing capacity of the lung for carbon monoxide. Only fres and FVC were selected by the procedure. fres was significant (p<0.0001), while FVC was not significant (p=0.1453), but acted as an important covariate in the model. The misclassification rate was 4.35%. The AUC was 0.98 (bootstrap 95% CI 0.89–1.00).
Table 5 demonstrates results of the stepwise logistic regression analysis. fres was highly significant as the most discriminatory variable for separating EDAC from control cases. The next most significant variable was FVC, which, although not statistically significant, was useful as a covariate. Using this regression in a confusion matrix predicted 14 out of the 15 EDAC cases when compared to controls, and there were no false positive cases.
Stepwise logistic regression analysis
Figure 5 shows the tabulated result of the CART analysis. Importantly, this regression demonstrated AX to be highly discriminatory. 14 out of 15 cases of EDAC had a value >3.523, whereas all eight controls had AX <3.523. Thus, the CART model is equally effective in predicting EDAC cases as the logistic regression, but uses a different variable. Stepwise logistic regression comparing COPD cases with EDAC versus those without EDAC showed that the following values were discriminatory in this order: X5, ΔAX, BMI, minimum X5 expiratory and Δfres (AUC 0.86, misclassification rate 25%). The CART analysis for this comparison found three predictors: FEV1/FVC ratio, AX (≥2.430) and ΔR20 (≥0.114), yielding. AUC 0.9478 (misclassification rate 10.5%).

Tabulated result of the classification and regression tree analysis. EDAC: expiratory dynamic airway collapse.
Discussion
Our study has shown that IOS can detect marked physiological changes in EDAC when spirometry is normal. This value-addition of IOS has not been shown before and provides a non-invasive way to begin investigations where EDAC is suspected. The expiratory values were more discriminatory than the mean values, and reactance values were more discriminatory than resistance values. Graphical representations (AX) were even more revealing [27]. In contrast, searching for a saw-tooth pattern on flow–volume loops was insensitive. The findings open the way for further investigation of IOS to monitor the effects of CPAP or stenting in EDAC [28] or its effect on exercise. IOS could also potentially add to the assessment of a patient with unexplained breathlessness or chronic cough who may have EDAC [21, 29].
The value of reactance data
Firstly, the magnitude of the reactance changes was similar to that seen in COPD, despite normal spirometry. Secondly, reactance was much more revealing than resistance data, and expiratory/inspiratory differences were much more useful than averaged data from across the breathing cycle. Dellacà et al. [24] demonstrated this importance of phased data: the worsening of derangements in expiration in that study is borne out in our study. Similarly, Dellacà et al. showed the greater potential of reactance (X) data compared to resistance (R) data to demonstrate airflow limitation: the R time course, unlike that for X, did not present clear differences between inspiration and expiration. Two articles have studied IOS in COPD [18, 30]. Both found that reactance rather than resistance correlated most with FEV1, RV and TLC. We observed increased resistance on expiration in controls, because this is a normal phenomenon. However, in our EDAC patients expiratory worsening was only observed for reactance changes. The highest R5 results were seen in COPD patients with EDAC suggesting the additive effects of peripheral and central airways obstruction [31]. Further study is needed as to whether such patients have worse dynamic hyperinflation than COPD patients without EDAC [32].
Thirdly, some of the subjects had reactance data that met the threshold criteria for EFL. This is remarkable, as these data were taken during quiet breathing and shows how EDAC can impact patients clinically with sequelae of intermittent obstruction including breathlessness. Conversely, the reactance data for those who did not exceed the threshold still showed significant reactance changes.
IOS more revealing than spirometry
Loring et al. [33] reported flow measurements on 80 patients with marked EDAC, and concluded that symptomatic central airway obstruction may exist without airflow obstruction on sprirometry. The expiratory IOS changes we observed in EDAC closely resemble the changes seen in fixed large airway obstruction [20, 34].
Possible role of resistance data in defining the site of airway obstruction
IOS findings in peripheral obstruction show more marked elevation of R5 than R20, and more negative reactance and a higher fres [27, 34]. Central airway obstruction is considered to show increased resistance at both low and high frequencies, and minimal impact on reactance [17, 27]. However, recent IOS results for central airway obstruction cases have also been reported to show “peripheral obstruction” patterns [1, 35]. Handa and colleagues [34, 35] demonstrated “peripheral” IOS findings in patients with cartilaginous tracheomalacia and marked spirometric abnormalities. The IOS findings reversed with airway stenting.
EDAC without and with COPD
Our data are unique, as they compare EDAC patients with and without COPD [1, 14] and show similar IOS data. The explanation for this may be as follows: normally, the resistance of the airway tree is low and impulses are freely transferred down the airway tree rather than across the walls of the central airways [36]. However, if airway resistance increases (due to either central or peripheral airway obstruction), impulses can be transferred (shunted) across the airway walls [37]. Pride [38] commented that using IOS to distinguish central from peripheral airway obstruction can be difficult, and others confirm that interpretation of IOS data is evolving. Our data were similar to those of Horan et al. [20], yet neither we nor others have confirmed previous suggested patterns of IOS showing the site of airway obstruction.
Some authors contend that central airway dynamic closure is always accompanied by peripheral airway closure, with choke points moving up from peripheral to central airways as in COPD [16, 34]. However, EDAC could arise in the absence of COPD from local smooth muscle weakness in the central airway, for example after prolonged coughing raising intrathoracic pressure, particularly in obese patients [1, 8, 11, 39]. Patients undergoing tracheopexy for EDAC have cough as the dominant symptom in 75% of cases [6, 19, 40]. Symptoms can improve after tracheopexy without improvement with FEV1 [6]. As these authors comment, a reliable physiological measure of improvement is needed.
Strengths and limitations
The strength of our study is a unique cohort in whom we have demonstrated a new application of IOS. Limitations of our study were firstly, that the subjects had IOS performed in a sitting position, whereas bronchoscopy was performed supine. This was because in preliminary trials subjects found it difficult to get a good seal on the mouthpiece when supine. If anything, this could have reduced our ability to detect a signal in the IOS group; that is, we would have expected a weaker signal for EDAC in the sitting position, as EDAC is worse when supine. Note that in presenting the data as z-scores we are accounting for differences in BMI, because mean data account for body weight, so a higher BMI was not the reason for more abnormal IOS data. Secondly, it is possible that some of the IOS changes were due to upper airway (supraglottic) closure. This is unlikely, because the IOS changes were not consistent with supraglottic obstruction [10] and there was no cut-off on the inspiratory flow–volume loop. Finally, we cannot explain why COPD patients did not have worse reactance findings if they had accompanying EDAC. We must assume that the effects of peripheral airway closure on IOS values overwhelms the central airway effects.
Conclusions
IOS can add to the workup of patients with suspected EDAC, particularly in those with normal lung function. The IOS expiratory reactance parameters in non-COPD patients were marked and were similar in magnitude to those seen in COPD.
Supplementary material
Supplementary Material
Please note: supplementary material is not edited by the Editorial Office, and is uploaded as it has been supplied by the author.
Supplementary material 00080-2018_supp
Acknowledgement
Mark J. Davis (Royal Brisbane and Women's Hospital, Herston, Australia) contributed technical assistance with impulse oscillometry and spirometry acquisition. Greg King (Ann Woolcock Institute, Sydney, Australia) provided helpful suggestions in manuscript preparation. This material was previously presented as a poster at American Thoracic Society Conference in San Diego (CA, USA) in 2009 [41].
Footnotes
This article has supplementary material available from openres.ersjournals.com
Author contributions: All the listed authors approved of the final article. D.I. Fielding (overall guarantor of the paper), J. Travers, S.C. Morrison and M.G. Brown conceived and designed the study, acquired and interpreted the data, and drafted and critically revised the paper for important intellectual content. P. Nguyen acquired and interpreted the data, and drafted and critically revised the paper for important intellectual content. G. Hartel interpreted the data, and drafted and critically revised the paper for important intellectual content.
Conflict of interest: D.I. Fielding has nothing to disclose.
Conflict of interest: J. Travers has nothing to disclose.
Conflict of interest: P. Nguyen has nothing to disclose.
Conflict of interest: M.G. Brown has nothing to disclose.
Conflict of interest: G. Hartel has nothing to disclose.
Conflict of interest: S. Morrison has nothing to discloseNone declared.
- Received June 3, 2018.
- Accepted September 2, 2018.
- Copyright ©ERS 2018
This article is open access and distributed under the terms of the Creative Commons Attribution Non-Commercial Licence 4.0.