Article Text

Abstract
Background: The effects of breathing pattern and inspired air conditions on the volume and content of exhaled breath condensate (EBC) were investigated.
Methods: Total exhaled water (TEW), EBC volume, pH, nitrite and protein concentrations were measured in three groups of 10 healthy subjects breathing into a condenser at different target minute ventilations (Vm), tidal volumes (Vt), and inspired air conditions.
Results: The volumes of both TEW and EBC increased significantly with Vm. For Vm 7.5, 15 and 22.5 l/min, mean (SD) EBC was 627 (258) μl, 1019 (313) μl, and 1358 (364) μl, respectively (p<0.001) and TEW was 1879 (378) μl, 2986 (496) μl, and 4679 (700) μl, respectively (p<0.001). TEW was significantly higher than EBC, reflecting a condenser efficiency of 40% at a target Vm of 7.5 l/min which reduced to 29% at Vm 22.5 l/min. Lower Vt gave less TEW than higher Vt (26.6 v 30.7 μl/l, mean difference 4.1 (95% CI 2.6 to 5.6), p<0.001) and a smaller EBC volume (4.3 v 7.6 μl/l, mean difference 3.4 (95% CI 2.3 to 4.5), p<0.001). Cooler and drier inspired air yielded less water vapour and less breath condensate than standard conditions (p<0.05). Changes in the breathing pattern had no effect on EBC protein and nitrite concentrations and pH.
Conclusion: These results show that condensate volume can be increased by using high Vt and increased Vm without compromising the dilution of the sample.
- EBC, exhaled breath condensate
- TEW, total exhaled water
- Vm, minute ventilation
- Vt, tidal volume
- exhaled condensates
- respiratory secretions
- ventilatory pattern
Statistics from Altmetric.com
Exhaled breath condensate (EBC) has been proposed as a non-invasive means of measuring airway inflammation. Unlike traditional methods of sampling secretions from the lower respiratory tract such as bronchoalveolar lavage, EBC analysis has the advantage of being simple to perform, may be repeated frequently, and can be applied to patients during both the stable and exacerbation phase of disease. The condensate derives from expired water vapour and volatile gases, but the presence of non-volatile solutes suggests that droplets of airway lining fluid have also been collected due to aerosolisation during turbulent airflow. Analysis of these solutes may potentially provide insights into the pathophysiology of lung diseases such as asthma,1–3 cystic fibrosis,4,5 and chronic obstructive pulmonary disease.6,7
While EBC shows promise as a source for biomarkers in pulmonary diseases, large variability has been reported in the concentration of solutes in EBC samples with considerable overlap between normal subjects and disease groups.4–7 In the absence of supporting data, much of this has been attributed to variations in the proportion of water vapour diluting the airway lining fluid or variations in flow affecting the amount of aerosolised solute. The dilution effect was recently studied by Effros et al8 who sought to quantify this by measuring ion concentrations in EBC. By assuming the airway lining fluid to be isosmolar to plasma, they estimated that variations in dilution may affect analyte concentrations by a factor of up to 100 or more. Previous studies of respiratory pattern and breath condensate have been inconclusive. Schleiss et al9 found that the concentration of the volatile solute hydrogen peroxide was dependent on flow rate, whereas Montuschi et al10 found 8-isoprostane levels to be independent of flow rate. They also found a high degree of variability in repeated samples even under controlled conditions, suggesting a mechanism other than dilution as a cause.
Although the major determinant of exhaled water vapour volume is minute ventilation (Vm) and duration of collection,11 the effect of differences in ventilatory pattern (such as tidal volume (Vt)) has not been quantified. It is also well established that cooler and drier inspired air produces a lower concentration of water vapour in the exhaled breath,12 yet this has not been quantitatively assessed in the context of EBC collection.
The aim of this study was therefore to determine the effect of ventilatory pattern (Vm and Vt) and inspired air conditions on the volume of condensate collected and the concentration of certain non-volatile solutes (nitrite and protein) and pH in EBC.
METHODS
Collection of EBC
EBC was collected on a commercial breath condenser (EcoScreen, Jaeger, Germany). Samples were collected in interchangeable sampling tubes (one per sample) with subjects breathing (with nose clip) through a non-rebreathing two way valve. All sampling tubes were disinfected for 30 minutes using 1% potassium monopersulphate solution (Virkon, Antec International Ltd, UK), rinsed for 2 hours by flushing with tap water, then rinsed with ultrapure water (ELGA Labwater, UK) and air dried prior to use. Samples were centrifuged (2000 rpm, 2 minutes) before measurement of volume, immediately frozen, and stored refrigerated at −80°C.
pH of EBC
The pH of the EBC was measured immediately after collection (without deaeration) using a calibrated pH meter incorporating an ISFET sensor with temperature compensation (model KS723, Camlab, Cambridge, UK) with an accuracy of ±0.1 pH.
EBC nitrite concentration
The nitrite concentration was determined by a colorimetric assay based on the Griess reaction13 in which triplicates of 100 μl EBC were reacted with 25 μl Griess reagent and measured at absorbance of 570 nm with a microplate reader (MR 710, Dynatec). Assay sensitivity was 0.5 μmol/l. Samples were stored in polypropylene containers and analysed within 4 weeks to minimise contamination and problems of instability.
EBC protein concentration
The protein concentration was measured based on the bicinchoninic acid method using a commercially available protein assay reagent kit (Micro BCA Protein Assay, Pierce, Rockford, IL, USA). Assay sensitivity was 0.5 μg/ml.
Measurement of flow, temperature, and humidity
To control and test for the effects of inspired air temperature and humidity the breath condenser was attached to a custom built device housing temperature, humidity, and flow sensors as shown in fig 1. Subjects breathed through a two way valve with temperature and humidity sensors located on the inspiratory and expiratory sides allowing measurement of the condition of the air inspired and the moisture content of the exhaled breath. Inspired air was supplied in a flow-past configuration from an air conditioning unit providing control over the air temperature and moisture content. Temperature sensors were K-type thermocouples (accuracy ±0.1°C). Humidity sensors were of thermoset polymer capacitance construction (accuracy of ±2%, Model HIH-3602-A, Honeywell, USA). Expiratory flow was measured using an ultrasonic phase shift flow meter (Model FR-413, BRDL, Birmingham, UK). The linearity of the sensor was <2% and the residual error due to temperature variation <1% in the temperature range 0–40°C. Together these measurements make possible calculation of the total quantity of exhaled water (TEW, see below).

Schematic of apparatus and instrumentation for measurement of total exhaled water and collection of exhaled breath condensate. Subjects breathe through a non-rebreathing two way valve at a pattern set by the ventilation targeting system which generates an audiovisual feedback signal setting ventilatory rate and expiratory flow, respectively. An air conditioning unit controls the temperature and moisture content of the inspired air. Temperature and humidity sensors are located as shown.
Ventilation pattern targeting
Ventilatory patterns were set by feeding the expiratory flow signal into a PC with purpose built breath targeting software which generated a visual and auditory target for expiratory flow rate and respiratory rate, respectively. Inspiratory to expiratory ratio was set at unity. Eucapnia was maintained at the higher minute ventilations by measuring end tidal CO2 and adding CO2 in the inspirate as necessary.
Thermocouple and humidity sensor output was conditioned by purpose built multichannel amplifiers. All signals were captured on a 16-channel computerised data acquisition system (Model 1401, CED, Cambridge, UK) which interfaced with software (Spike 2, CED, Cambridge, UK) to allow real time signal display and storage of data to disk.
Effect of additional circuit and instrumentation on EBC collection
To assess any effects from the added dead space associated with the flow meter and other instrumentation, EBC collections were taken at equivalent ventilatory patterns with 10 subjects breathing directly through the standard two way non-rebreathing valve attached to the breath condenser alone and flow measured at the expiratory port of the condenser.
Effects of breathing pattern on EBC collection
To test the effect of Vm, EBC was collected from 10 healthy non-smoking subjects over timed 6 minute intervals at three target Vm values (table 1, protocol 1), each at high and lower target Vt. The conditions of the inspired air were measured and maintained at 22°C.
Protocol designs showing ventilatory patterns and inspired air conditions
To test the effects of Vt, EBC was collected from 10 healthy non-smoking subjects over timed 6 minute intervals for a fixed target Vm at high and low target Vt patterns at an inspired temperature of 7°C.
Effect of inspirate temperature and humidity
At a fixed ventilatory pattern (Vt 1500 ml, 10 breaths/min), 6 minute collections of EBC were taken with 10 subjects breathing warm room air (20°C) and colder, drier air (9°C) (table 1, protocol 3).
Analysis of data
Total exhaled water (μl) for each 6 minute collection period was calculated as:

where w = absolute humidity of exhaled air (g/kg), Vt = total respired volume (litres ATPS from integrated flow meter signal), ρa = air density (20°C), and ρw = water density (20°C). The absolute humidity of expired air was derived from the mean temperature and moisture sensor signal (measuring relative humidity) which were referred to the physical properties of moist air at atmospheric pressure.
Statistical analysis was performed using SigmaPlot 2001 for Windows version 8.0 and Sigmastat 2001 for Windows (SPSS Science Inc, USA). Paired t tests were used to compare the EBC data and a value of p<0.05 was considered significant. Two way ANOVA was used for the analysis of Vm data and Friedman’s two way analysis of variance for data which were not normally distributed (Minitab release 14, Statistical Software, Minitab Inc, USA) was used for the relationship between ventilation and EBC protein, nitrite, and pH.
Study approval for tests on human subjects was granted by the Lothian regional ethics committee and consent was obtained from all participating subjects.
RESULTS
Effect of additional circuit and instrumentation on EBC collection
No difference was found in the volume of EBC or the pH, nitrite and protein concentrations when subjects breathed with or without the instrumented tubing section joined to the condenser based on paired t tests where a p value of >0.05 was not considered statistically significant (EBC: 1155 μl with and 1029 μl without, mean difference 136 μl (95% CI −14 to 286); pH: 6.3 v 6.4, mean difference 0.1 (95% CI −0.15 to 0.35); nitrite: 4.1 v 4.0, mean difference 0.1 (95% CI −0.72 to 0.92); protein: 8.1 v 5.1, mean difference 3.5 (95% CI −0.3 to 7.3)).
Effect of Vm on TEW
For target Vm values of 7.5, 15 and 22.5 l (all at Vt 1.5 l), subjects achieved mean (SD) values of 8.6 (1.95), 15.1 (2.55), and 22.8 (3.27) l/min, respectively. The effect of Vm on TEW and EBC volumes is shown in fig 2. These data were analysed using two way analysis of variance with repeated measures and Tukey’s method for multiple comparisons. For all values of Vm the volume of TEW was significantly greater than the EBC volume (p<0.001). For both TEW and EBC there was a significant increase in volume with increased Vm (p<0.05). The volume of TEW rose significantly more with Vm than did the volume of EBC (p<0.001).
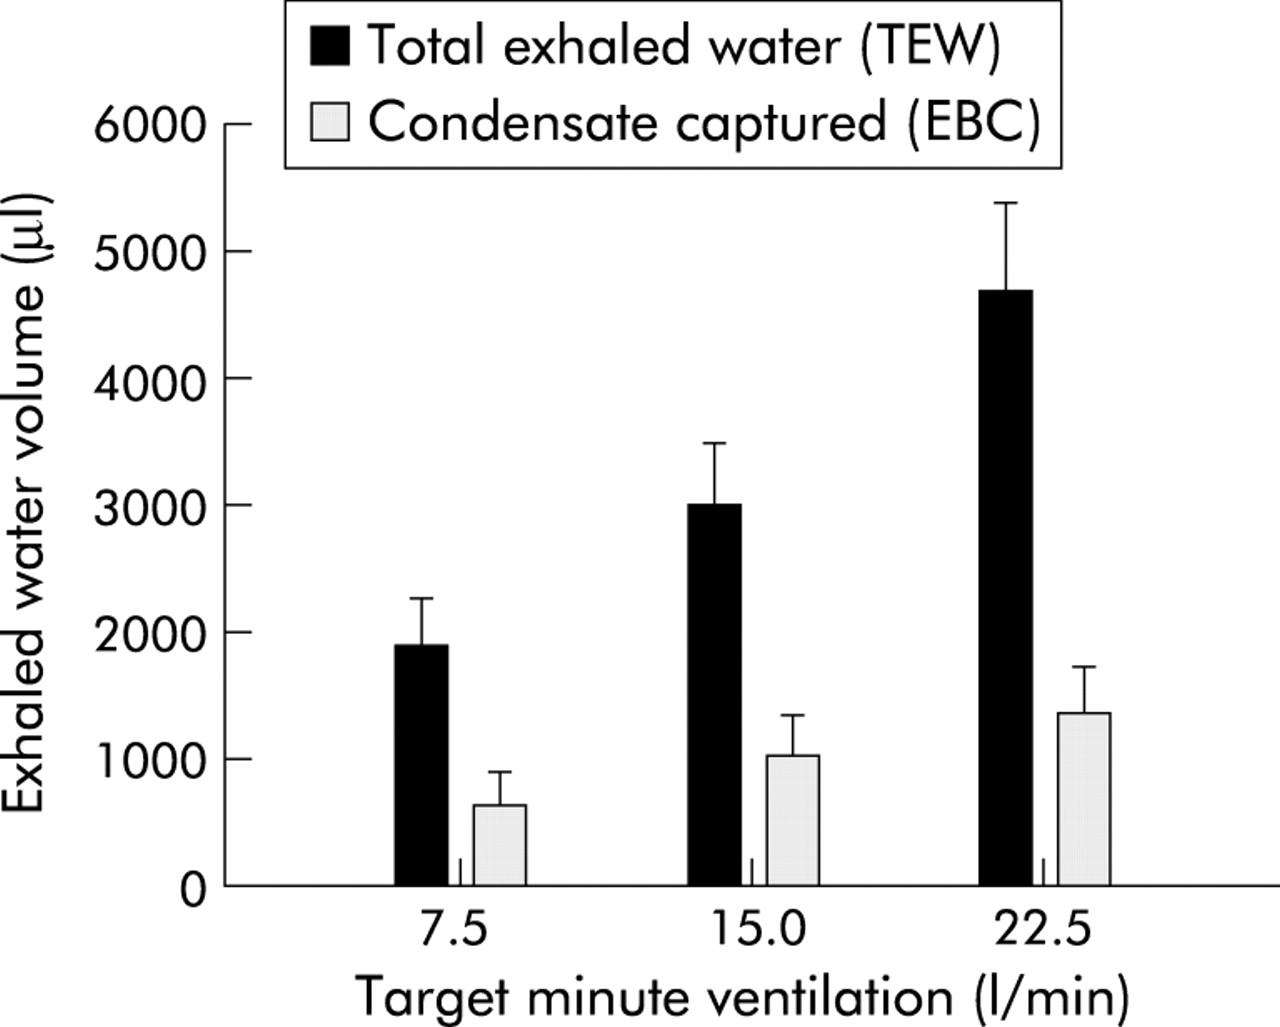
Volumes of total exhaled water (TEW) and exhaled breath condensate (EBC) collected from 10 subjects breathing at three minute ventilation (Vm) targets. Using two way analysis of variance with repeated measures and Tukey’s method for multiple comparisons, the volume of TEW was significantly greater than the EBC volume at all values of Vm (p<0.001). For both TEW and EBC there was a significant increase in volume with increasing Vm (p<0.05). The volume of TEW rose significantly more with increased Vm than did the volume of EBC (p<0.001). Limits denote standard error of the mean.
For Vm values of 7.5, 15 and 22.5 l/min the mean (SD) volume of EBC was 627 (258) μl, 1019 (313) μl, and 1358 (364) μl, respectively (p<0.001) and the volume of TEW was 1879 (378) μl, 2986 (496) μl, and 4679 (700) μl, respectively (p<0.001). Water vapour availability (TEW) was significantly higher than EBC, giving a condenser efficiency of 40% at Vm 7.5 l/min which decreased to 29% at Vm 22.5 l/min.
Effect of Vt at fixed Vm
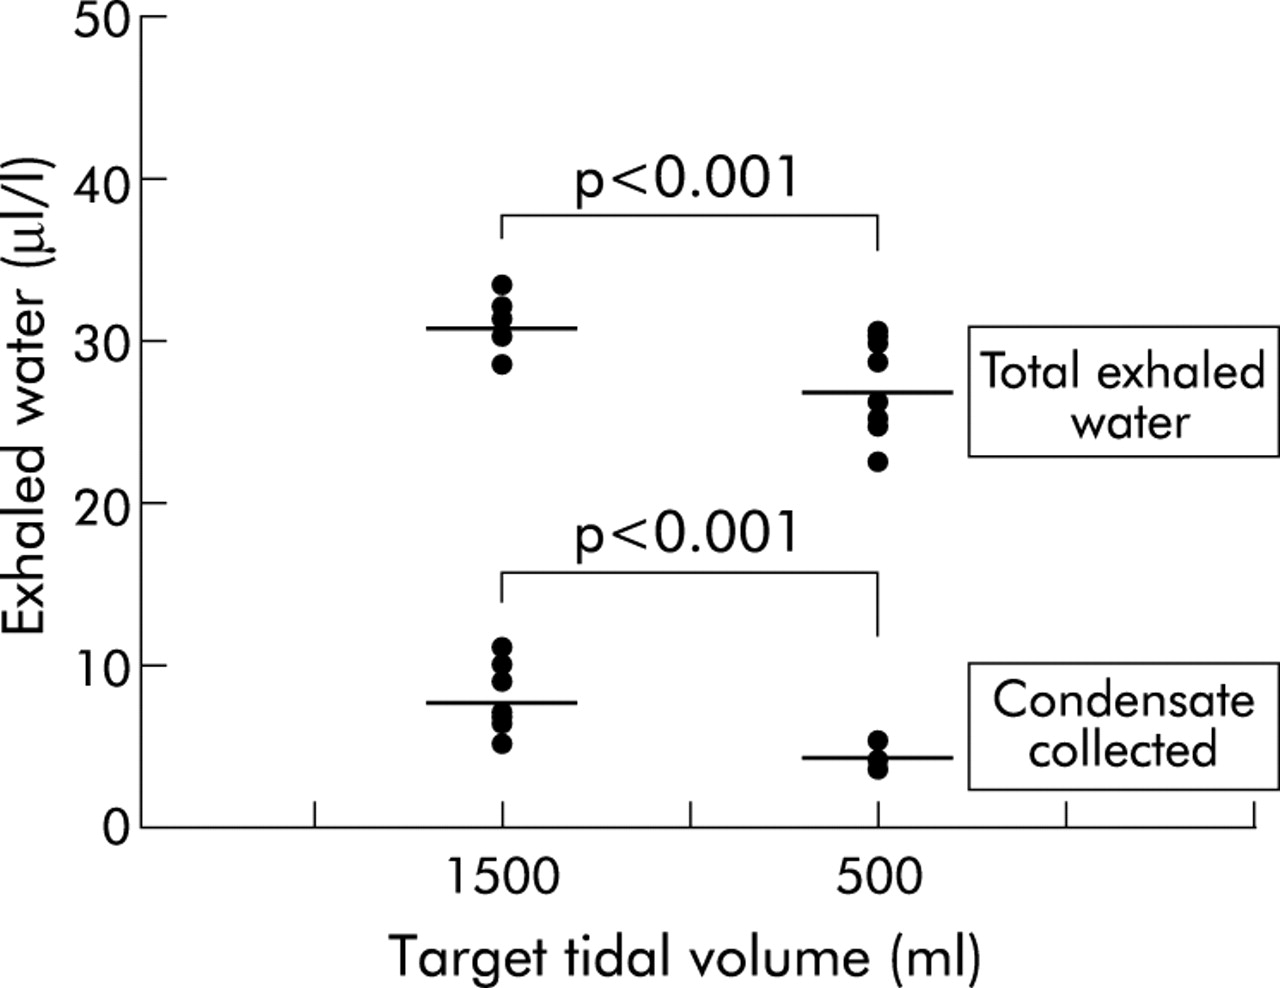
For target Vt values of 500 ml and 1500 ml, subjects achieved actual target volumes of 578 (98) ml and 1540 (232) ml. The effect of Vt is shown in fig 3 where lower Vt patterns gave significantly less TEW (per litre respired) than higher Vt (26.6 v 30.7 μl/l, mean difference 4.1 (95% CI 2.6 to 5.6), p<0.001). This was also reflected in the volume of EBC collected (4.3 v 7.6 μl/l, mean difference 3.4 (95% CI 2.3 to 4.5), p<0.001).

Effect of tidal volume (Vt) on measured volumes of exhaled water and breath condensate. At lower Vt subjects yielded less exhaled water and breath condensate per litre respired for the same minute ventilation; p values denote the level of significance based on paired t tests. Limits denote standard error of the mean.
Effect of inspired air conditions
Subjects breathing at equivalent ventilatory patterns but with cooler, drier inspirate were found to yield less water vapour (TEW 33.4 v 35.6 μl /l, mean difference 2.2 μl /l (95% CI 0.2 to 4.2), p<0.05) and less breath condensate (EBC 8.6 v 10.1 μl/l, mean difference 1.5 μl /l (95% CI 0.3 to 2.7), p<0.05).
Effect of ventilatory pattern on exhaled pH, nitrite and protein
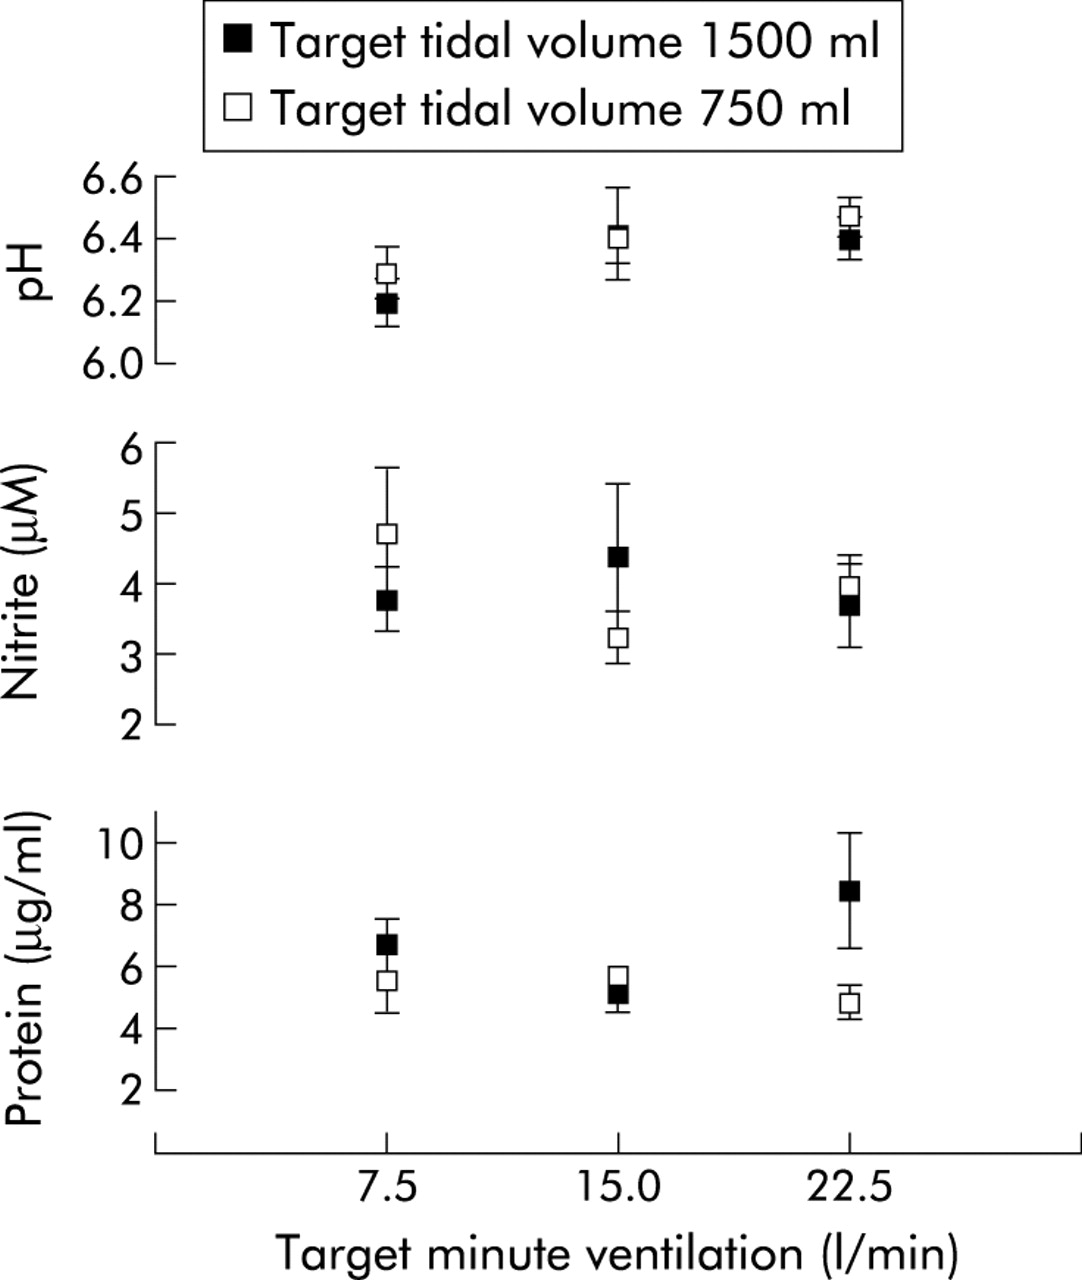
Despite the effects of Vm and Vt on condensate volume (figs 2 and 3), the ventilatory pattern had no significant effect on condensate pH, nitrite and protein concentrations using Freidman’s two way analysis of variance (since data were not normally distributed). Overall mean (SD) concentrations of protein and nitrite in the EBC were 6.0 (3.4) μg/ml and 3.9 (2.2) μM, respectively, and pH was 6.3 (0.3); fig 4.
Mean EBC protein and nitrite concentrations and pH for each target minute ventilation (Vm) and tidal volume (Vt). Despite the effects of Vm and Vt on condensate volume (figs 2 and 3), Friedman’s analysis of variance showed that Vm and Vt had no effect on EBC concentrations of protein, nitrite, or pH (all p>0.05).
DISCUSSION
The volumes of both TEW and EBC increased significantly with Vm. The volume of EBC varied between 627 μl and 1358 μl for a 6 minute collection in the Vm range 7.5–22.5 l/min. This indicates that, for this collection device with subjects breathing at a typical resting Vm of 10 l/min, a 6 minute collection would generate a sample of approximately 900 μl. The volume of TEW was significantly higher than the volume of EBC throughout the Vm range studied. This indicates that the condenser efficiency is far from 100% (range 40–29%). It would be reasonable to suppose that this inefficiency also applies to the trapping of aerosolised droplets and that a device with improved efficiency would yield an increased quantity of solutes, thereby enhancing the sensitivity of this technique. A mean reduction of 962 ml in Vt was associated with a 15% reduction in TEW for the same Vm; however, no corresponding effect was seen on solute dilution. This would imply that, at lower Vt, proportionally less solute is aerosolised for a given Vm and therefore the concentrations of solutes are maintained constant.
Inspired air conditions were found to have a small but significant effect on volumes of TEW and EBC. A fall in the inspired air temperature and humidity was associated with a reduction of up to 6% in TEW and EBC, implying a similar degree of reduction in the dilution of solutes under cooler, drier conditions. However, this was not seen in the concentrations of nitrite and protein measured, probably because the effect—although significant—was small relative to the measurement error associated with assays of very small quantities of solutes. It is therefore unlikely that variations in inspired air conditions commonly encountered in the laboratory would account for significant measurement error.
The absence of an effect of ventilatory pattern on the protein concentration suggests that non-volatile solute concentrations are independent of breathing pattern. This is supported by the findings of Montuschi et al10 for 8-isoprostane. pH is influenced by volatile solutes yet still showed no variance with breathing pattern, which suggests that breathing pattern is not an important determinant of either volatile or non-volatile solute concentrations in EBC. However, this finding is in contrast to the results of Schleiss et al9 for hydrogen peroxide in EBC. They proposed a bi-compartmental model which argues that, if solute concentration is not flow dependent, then this would imply that solutes were arising from the more distal airway and alveolar region. An alternative explanation is that the aerosolisation is flow dependent, occurring in the proximal airway during inspiration and expiration with the net expiratory flux contributing to EBC. This process occurs in parallel with evaporation and condensation of water from the airway lining fluid, thereby maintaining constant the ratio of analyte to water vapour dilution.
For the purpose of comparison, the inspiratory to expiratory (IE) ratio in this study was set at 1:1 with subjects also being required to reproduce a square wave expiratory waveform. It is recognised that the ventilatory pattern is not solely defined by Vm and Vt, but that factors such as IE ratio and the shape of the inspiratory/expiratory flow rate signals may also be important in the context of airway water transport. Mathematical models of this complex process14 would suggest that a low IE ratio pattern would result in a lower expiratory water vapour concentration than a high IE pattern for the same Vt and Vm. It is also likely that the IE ratio will have an effect on the net flux of aerosolised droplets. Further studies are required to assess the significance of this effect on water vapour and analyte concentrations in EBC collections.
This study has shown that the effect of ventilatory pattern and inspired air conditions on exhaled water vapour and EBC volume to be significant but insufficient to explain the high degree of variability in solute concentrations seen in the studies by Effros et al8 and others.4,7,9 Likely sources of this variability include variation in aerosolisation, capture of droplets, and assay variability rather than water vapour dilution. Future attention must therefore be directed towards minimising these sources of variability in order to improve the overall sensitivity of this technique.
In conclusion, these results suggest that condensate yield can be significantly augmented by targeting the ventilatory pattern to higher tidal volumes (>1000 ml)) and minute ventilations over 15 l/min. Such augmentation will not significantly affect analyte concentrations.
Acknowledgments
The authors acknowledge the contribution of Dr PA Kew and Mr A Haston, Department of Mechanical Engineering, Heriot-Watt University, Edinburgh for technical assistance with instrumentation, and Ms M Imrie, Respiratory Unit, Western General Hospital for assistance with nitrite and protein assays.
REFERENCES
Footnotes
-
Funded by Chest, Heart and Stroke Scotland, UK