Article Text

Abstract
Background: Regional body composition was determined in adults with cystic fibrosis (CF). Our hypothesis was that dual energy x ray absorptiometry (DXA) scanning could assess the fat free mass, bone mineral content, and fat mass and determine the distribution of the changes.
Method: Height squared indices were derived for fat mass (FMI), fat free mass (FFMI), and bone mineral content (BMCI) of the arm, leg, and trunk by DXA in 51 patients and 18 age/sex matched healthy subjects.
Results: The arm and leg FFMI in patients were less than in healthy controls (p<0.05); the deficit was leg>arm>trunk (−18.19%, −14.86%, +0.09%, p<0.02) and was related to severity of lung disease. Patients with a normal BMI and low total FFM (hidden loss) had a lower arm, leg and trunk FFMI than those with a normal BMI and total FFM (p<0.05). The BMCI for all body segments was lower in patients than in controls (p<0.001). The BMCI was lower in the leg and trunk (p<0.01) in patients with severe disease than in those with mild lung disease. In those with hidden FFM loss the BMCI was lower (p<0.05 in leg and trunk). There was no difference in the BMCI deficit between body segments. Fat mass in patients was not reduced.
Conclusion: Preferential loss of FFM is related to severity of lung disease and occurs in patients with a normal BMI. A similar loss of BMC occurs while FM is preserved. A hierarchical pattern of FFM loss of legs>arms>trunk was shown; BMC loss was evenly distributed.
- cystic fibrosis
- body composition
- dual energy x ray absorptiometry
- lung function
- fat free mass
Statistics from Altmetric.com
In cystic fibrosis (CF) both weight loss and altered body composition are associated with greater morbidity and mortality.1 Such changes may be related to an imbalance between energy intake and energy needs.2 The causes of this imbalance probably include the severity of the lung disease, impaired inspiratory muscle function, and systemic inflammation.3,4 Physical inactivity, reduced sex hormone levels, increased resting energy expenditure, and hypoinsulinaemia may also be contributing factors.
In routine clinical practice body mass index (BMI) is widely used to assess nutritional status, but does not inform on body composition and may fail to detect subtle alterations in body composition. An inapparent loss of skeletal muscle may occur in patients who retain their normal body weight.5–,7 Various methods are available for the determination of body composition.8–,10 Dual energy x ray absorptiometry (DXA) has the advantage of giving whole body composition in terms of fat mass (FM), fat free mass (FFM), and bone mineral content (BMC)—the actual mineral, calcium hydroxyapatite. Subregional analysis of the tissues in the limbs and trunk has been performed in healthy subjects11 and in a few disease states including chronic obstructive pulmonary disease. DXA has been used to compare peripheral and central distribution of body composition,12,13 to quantify the effects of growth hormone treatment on FFM,14 and to relate muscle mass to strength of the lower limb15,16 and physical disability.17
Based on the altered body composition, particularly loss of FFM, seen in patients with CF and its association with the severity of lung disease, systemic inflammation, resting energy expenditure, catabolic intermediary metabolism and the rate of exacerbations of respiratory symptoms,3,4,18 we hypothesised that DXA scanning could be used to determine regional body composition in adult patients with CF. We further hypothesised that differences would occur in regional body composition because underlying multiple causative factors were likely to have differential effects. We also expected evidence of preferential loss of FFM and BMC in some patients due to the previously reported protein catabolic state.
METHODS
Patients
Fifty one adults (25 men) with proven CF (sweat Na+ and Cl− >70 mmol/l and a CF genotype) and chronically infected with Pseudomonas aeruginosa were studied when clinically stable—defined as no change in pulmonary symptoms, no new systemic symptoms, no change in medication, and a <10% reduction in forced expiratory volume in one second (FEV1) in the month before the assessment. Eighteen healthy subjects (nine men) were also studied. The study was approved by the local research ethics committee and all subjects gave full written consent.
Body composition
Weight was determined with an electronic scale and height was measured bare foot with a stadiometer. Body mass index (BMI) was calculated (kg/m2).
Dual energy x ray absorptiometry (DXA)
Whole body DXA scans (Hologic QDR2000+, Hologic Inc, Waltham, MA, USA) were performed before a meal and with an empty bladder. Subjects were scanned supine using a pencil beam mode, enhanced software, and a calculated radiation dose of 4.6 μSv. Each scan took 15–20 minutes. The coefficient of variation (CV) of the Hologic QDR 2000+ for whole body calculation was 0.4–1.0%.19 The BMC, FM and FFM (excluding BMC) were determined and corrected for body habitus using height squared to give indices BMCI, FMI, and FFMI which were calculated for each limb and the trunk. A height squared ratio was used to control for the influence of potential delayed or impaired growth, which is particularly important in CF, and to allow comparisons between mixed sex groups.20–,22 Limb segments were identified using the DXA software with operator adjustment to ensure that the upper limb was demarcated by a line between the head of the humerus and glenoid fossa and the lower limb demarcated by a line made through the femoral neck. The head was separated from the trunk at the inferior level of the mandible. Comparison was made between the right and left limbs and no difference was found within patients or healthy subjects between the two upper limbs and the two lower limbs for each tissue component. The right arm and right leg were therefore selected in each subject for direct comparison.
In the healthy subjects FFM was within the limits of a healthy UK population of the same age and sex, although these data were generated from anthropometric measurements.23 Patients were defined by their total FFM by DXA: (1) low FFM was less than the lower 5th percentile for healthy subjects22; (2) normal FFM was more than the lower 5th percentile for healthy subjects.20
Lung function
Forced expiratory volume in 1 second (FEV1), forced vital capacity (FVC), and their ratio were determined in the patients as the best of three measurements by spirometric testing (Vitalograph Ltd, Bucks, UK). For analysis based on the severity of lung disease, patients were defined by airways obstruction: mild impairment=FEV1 ⩾65% predicted; moderate impairment=FEV1 >46–<65% predicted; severe impairment=FEV1 ⩽45% predicted.24
Physical activity
This was determined in patients using a recall questionnaire relating to physical activity in the preceding month. The activity score was expressed in METS (1 MET=the energy expended by a person at rest).25
Analysis of data
Data were normally distributed and are presented as mean (SD) values. Differences between populations are presented as mean (95% confidence interval, 95% CI). Continuous variables with normal distributions were compared using either t tests or one way ANOVA when three groups were compared. All statistical analyses were performed using the Statistical Package for Social Sciences (SPSS) for Windows, Version 11.0. A p value of <0.05 was considered statistically significant. Pearson’s correlation coefficients were calculated and multivariate linear regression analysis determined the significance of these independent factors.
To define tissue deficits we used the mean for the healthy subjects (presumed “ideal”) for a given tissue (FFMI, FMI and BMCI) in a given compartment (arm, leg and trunk) and expressed each patient’s result for the same tissue and compartment as a proportion.
RESULTS
The demographic characteristics of the subjects are shown in table 1⇓. Of the 51 patients, 28 (12 men) had a low BMI (<19.9 kg/m2) of which 21 (6 men) also had a low FFMI. Of the 23 patients with a normal BMI, 10 (3 men) had a low FFMI (hidden FFM loss) while the other 13 (10 men) had a normal FFMI. Men were significantly taller in both populations together, with the patients being shorter than the healthy subjects.
Demographic characteristics of study subjects
Comparison of body composition between whole patient group and healthy subjects
Fat free mass index (FFMI)
The arm and leg FFMI were lower in patients than in healthy subjects while the trunk FFMI was similar (table 2⇓). The absolute difference in arm, leg and trunk FFMI (kg/m2) compared with healthy subjects followed the same pattern for the group as a whole and for each sex separately. The mean difference (95% CI) for the men was: arm −0.126 (−0.216 to −0.036), p=0.008; leg −0.412 (−0.677 to −0.147), p=0.003; trunk 0.231 (−0.375 to 0.836), p=0.443, and for the women was: arm −0.108 (−0.191 to −0.026), p=0.011; leg −0.506 (−0.719 to −0.292), p<0.001; trunk −0.19 (−0.824 to 0.444), p=0.547.
Comparison of indexed tissue parameters (kg/m2) in each of the body segments between patients and healthy subjects
The proportionate FFMI deficit in patients was greatest in the leg, followed by the arm and then the trunk. The difference in deficit between body segments was significant (p<0.02) in all cases (fig 1⇓). The arm, leg, and trunk FFMI were individually related to physical activity (r=0.555, p<0.001; r=0.652, p<0.001; and r=0.507, p<0.001, respectively); using multivariate regression, this independent factor was significant (arm 7.4%, leg 17.1%, trunk 10.2%).

Fat free mass index (FFMI) in the whole patient population and stratified according to the severity of airways obstruction. The difference between the mean patient data and the 100% “ideal” is the deficit (%) and is presented numerically above the graph.
Bone mineral content index (BMCI)
The BMCI was less in patients than in healthy subjects for the arm, leg and trunk (table 2⇑). The BMCI in each body region of the patients compared with the mean BMCI of the healthy subjects was reduced, but was not different between each region (fig 2⇓).

Bone mineral content index (BMCI) in the whole patient population and stratified according to the severity of airways obstruction. The difference between the mean patient data and the 100% “ideal” is the deficit (%) and is presented numerically above the graph.
Fat mass index (FMI)
There was no difference in FMI between patients and healthy subjects for any body segment (table 2⇑). There was an inverse relationship between arm FMI and FFMI (r=−0.4, p=0.003) and leg FMI and FFMI (r=−0.339, p=0.015), indicating preferential loss of FFM.
Severity of lung disease and changes in body composition
Fat free mass index
There were 20 patients with mild disease, 11 with moderate lung disease, and 20 whose disease was categorised as severe. A comparison was made between the mild and severe subgroups to determine the extremes of the spectrum. The FFMI for all body segments was less in the severe lung disease group than in the mild group (all p<0.05, table 3⇓). The deficit in FFMI in the severe group followed the pattern of leg (−28.68%) > arm (−23.76%) > trunk (−3.93%), and the differences between the three regions were significant (all p<0.02, fig 1⇑). The leg, arm and trunk FFMI in the patients with severe lung disease were each related to the FEV1 (r=0.556, p<0.001; r=0.429, p=0.002; r=0.418, p=0.003, respectively). Multiple regression indicated that FEV1 was a significant independent factor for the leg (4.2%).
Comparison of indexed tissue parameters between patients with mild and severe lung disease for each body segment
There was no difference in FFMI in any segment between patients with mild disease and healthy subjects.
Bone mineral content index
The BMCI was reduced for the leg and trunk in the group with severe lung disease compared with the mild group (table 3⇑). The deficit in the arm, leg, and trunk in the group with severe disease did not differ between the three body compartments (p>0.05, fig 2⇑).
The BMCI was lower in all three segments in patients with mild disease than in the healthy controls (p<0.01 in all cases).
Comparison between patients with normal BMI and total FFM and those with hidden FFM loss
Fat free mass index
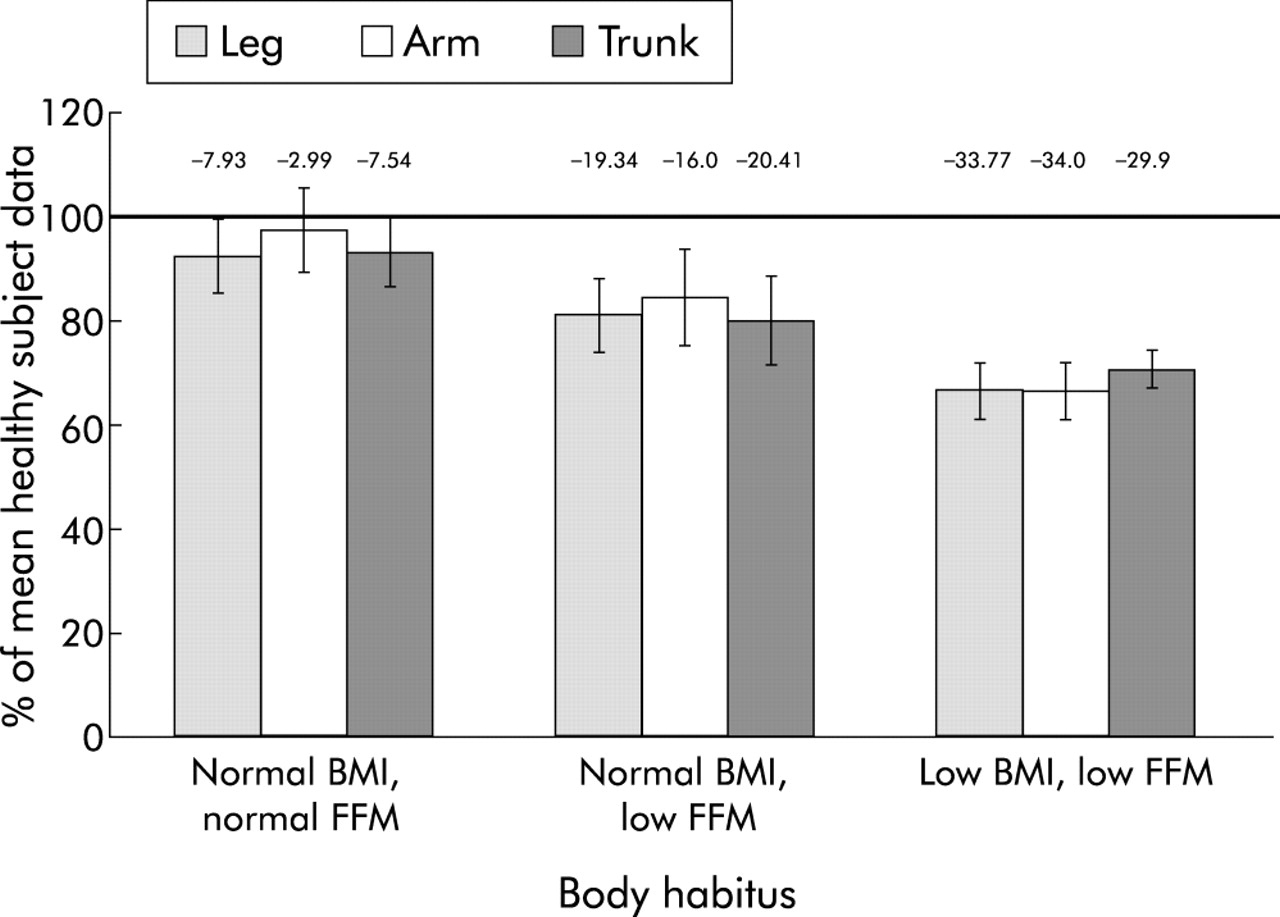
Patients with hidden FFM loss had a lower (p<0.05) mean (95% CI) FFMI for the arm, leg, and trunk (difference −0.24 (−0.38 to −0.10), −0.66 (−0.98 to −0.33) and −1.01 (−1.73 to −0.29) kg/m2 respectively) compared with those with a normal BMI and total FFM. The distribution of the FFMI deficit in the hidden loss group (related to the healthy subject “ideal”) was similar in the arm (−25.02%) and leg (−24.48%, p=0.889), while both these deficits were greater than the trunk deficit (−1.77%, p<0.001; fig 3⇓). No deficit in the arm, leg, or trunk was detected in patients with a normal BMI and total FFM compared with the healthy subjects (fig 3⇓).

FFMI in the whole patient population and stratified according to their total body habitus. The difference between the mean patient data and the 100% “ideal” is the deficit (%) and is presented numerically above the graph.
Bone mineral content index
A lesser BMCI also occurred in the hidden loss group compared with the group with normal BMI and total FFM. The mean (95% CI) differences (kg/m2) between these two groups were: arm −0.007 (−0.016 to 0.001), p=0.09; leg −0.021 (−0.042 to −0.0002), p=0.047; and trunk −0.032 (−0.06 to −0.006), p=0.012. There was no significant difference (p>0.05) between the arm, leg, or trunk for the deficit of BMCI (fig 4⇓) in the group with hidden loss.
BMCI in the whole patient population and stratified according to their total body habitus. The difference between the mean patient data and the 100% “ideal” is the deficit (%) and is presented numerically above the graph.
Comparison between patients with a hidden FFM loss and those with a low BMI and total FFM
Fat free mass index
There was no statistical difference in the FFMI in any body region between patients with hidden loss and those with a low BMI and total FFM (p>0.05).
Bone mineral content index
The BMCI in the low BMI, low total FFM group was less than in the hidden FFM loss group. The mean differences (kg/m2) were: arm −0.01 (−0.02 to −0.003), p=0.004; leg −0.026 (−0.046 to −0.008), p=0.003; and trunk −0.024 (−0.049 to 0.001), p=0.057. There was no significant difference in the deficit of BMCI (fig 4⇑) between body regions (p>0.05) in the patients with a low BMI and a low total FFM.
DISCUSSION
Use of DXA scanning allowed quantification of key components of body composition in the limbs and the trunk of patients with CF and chronic pulmonary infection with P aeruginosa. The pattern of change indicated that such patients had a preferential loss of FFM and BMC compared with FM. In addition, there was a differential distribution of FFM loss between the limbs and trunk, suggesting loss of skeletal muscle, a major component of limb FFM. Loss of truncal skeletal muscle may have been partly obscured by the inclusion of viscera in the measurement of FFM and represents a limitation of DXA scanning which cannot distinguish body wall musculature from the viscera. Other protein rich tissue such as bone organic matrix may also be lost, although a differential pattern of loss of BMC was not found.3,4
It is likely that many mechanisms underlie the loss of FFM in our patients including reduced physical activity and catabolic intermediary metabolism causing increased cellular and connective tissue proteolysis.3,4 Continuous catabolic intermediary metabolism could explain the preferential loss of FFM, largely affecting muscle mass, and bone organic matrix proteins with reduced bone mineralisation. Such a systemic process might be expected to cause a diffuse pattern of loss as found with the BMC. The 15% reduction in upper limb FFMI seems excessive for the effect of reduced activity alone and, perhaps, indicates that a major component of FFM loss here is due to a systemic mechanism. However, the hierarchical leg, arm and trunk pattern of differential FFM loss may reflect an additional effect of other mechanisms such as reduced physical activity, which might have its major impact on leg muscles. The relationship between loss of FFM and physical inactivity tends to support this interpretation, but a cross sectional study does not allow causative mechanisms to be determined. A longitudinal study may indicate whether loss of FFM and hence skeletal muscle leads to reduced activity or whether the FFM loss is largely due to disuse.
The hierarchical pattern of FFM loss between the limbs and the trunk was also evident when composition was related to the severity of lung disease, which may have had its effects through inflammatory catabolic mechanisms and physical inactivity. In this group of patients as a whole we have previously reported increased excretion of N-telopeptides of collagen-1 (NTx) which was related to the severity of lung disease and systemic inflammation.3 This also supports the view that reduced physical activity may have a lesser effect than the systemic inflammatory catabolic response, although this interpretation is speculative. The possibility that a systemic process had a major effect on FFM loss is supported by the lack of difference between arm and leg FFM deficit in the hidden FFM loss group and by the non-segmental separation of the loss of BMC in all analyses.
The maintenance of FM suggests preferential systemic proteolysis which predominantly causes skeletal muscle and bone organic matrix loss. This could be explained by enhanced utilisation of protein for energy production in response to a negative energy balance and the pro-proteolytic effects of the catabolic intermediary metabolism that occurs in such patients. The preservation of FM explains the limited value of BMI as an indicator of body composition changes and how hidden loss of FFM can occur. However, these patients show evidence of lipolysis, which may represent futile lipid cycling.26,27 These changes also indicate that the energy imbalance in CF is not simply a malnutrition like response to starvation, but more resembles an acute response to trauma or infection.28
Limitations of the study
We used DXA with available software in preference to other methods to determine regional body composition. This study could be criticised for using DXA data without applying corrections for acknowledged assumptions.11 In other studies body composition has been determined in subregions with extensive use of corrections for tissue hidden by bone and to allow for limb shape before comparing differences between subjects. However, most of these studies were in small groups of healthy subjects of different body habitus. We did not use such corrections because they make a number of methodological assumptions and it is unclear if they are applicable to patients.11 In addition, the accuracy and repeatability of DXA are high and difficult to supersede without significant radiation exposure or resource implications.11,29,30 There is no consensus as to how the results of regional body composition should be expressed and various ratios have been published. From a clinical perspective, DXA allows determination of total body content of three major tissue groups and, as shown here, can detect differences in tissue composition of the limbs and trunk. This is achieved with a low radiation exposure in a quick and convenient manner. Its availability is becoming more widespread and has the added benefit of determining the bone mineral density. This has added clinical value in patients with respiratory disease who may be more susceptible to osteoporosis.
Using DXA scanning, we were able to show preferential FFM loss in patients with CF and chronic P aeruginosa infection and a differential pattern of changes in segmental tissue composition suggestive of the effects of various mechanisms underlying FFM loss. These findings suggest that DXA scanning may have a useful role in the assessment of patients with chronic respiratory diseases associated with loss of body mass.
Acknowledgments
This study was supported by the Cystic Fibrosis Trust (UK), the Astra Foundation (UK), the British Lung Foundation, and the British Thoracic Society.
REFERENCES
Footnotes
Conflict of interest: none.